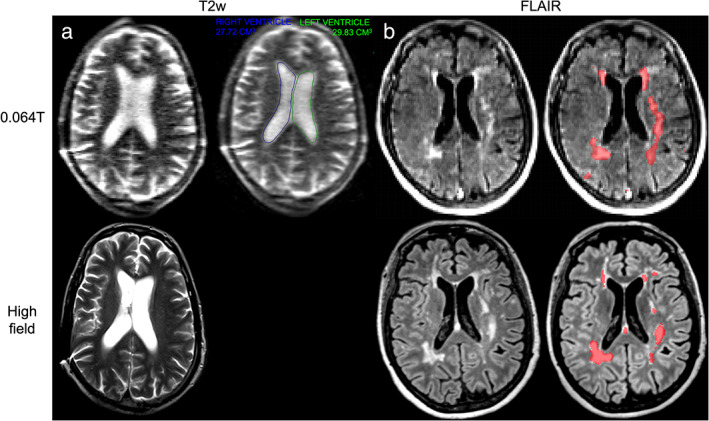
FIGURE 5.

Hydrocephalus and multiple sclerosis patients imaged at 0.064T (top) and high‐field (bottom). (a) T2w scans of a 55‐year‐old male with a history of hydrocephalus imaged at 0.064T (scan time: 7:01 minutes) and high‐field. A deep learning‐based ventricular segmentation algorithm was applied to 0.064T imaging to determine ventricular volumes. Data and algorithm output were visualized in the scanner's picture archiving and communication system. The right ventricle (blue line) had a volume of 27.72 cm3, while the left ventricle (green line) had a volume of 29.83 cm3. (b) Fluid‐attenuated inversion recovery imaging of a 66‐year‐old female with relapsing–remitting multiple sclerosis at 0.064T (scan time: 9:29 minutes) and 3T (scan time: 5:02 minutes). Automated segmentations of lesions generated using the respective images are overlaid in red on the righthand side.
