FIGURE 9.

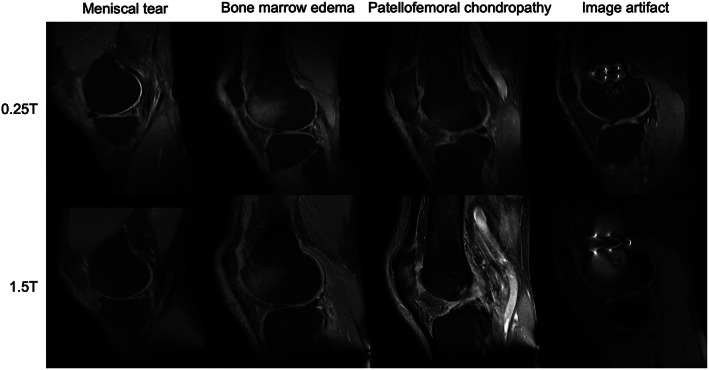
Examples of musculoskeletal imaging at 0.25T (top) and 1.5T (bottom). Images provided courtesy of Dr. Riccardo Monti, Dr. Frederico Bruno, Prof. Antonio Barile, and Prof. Carlo Masciocchi, University of L'Aquila, Italy.

Examples of musculoskeletal imaging at 0.25T (top) and 1.5T (bottom). Images provided courtesy of Dr. Riccardo Monti, Dr. Frederico Bruno, Prof. Antonio Barile, and Prof. Carlo Masciocchi, University of L'Aquila, Italy.