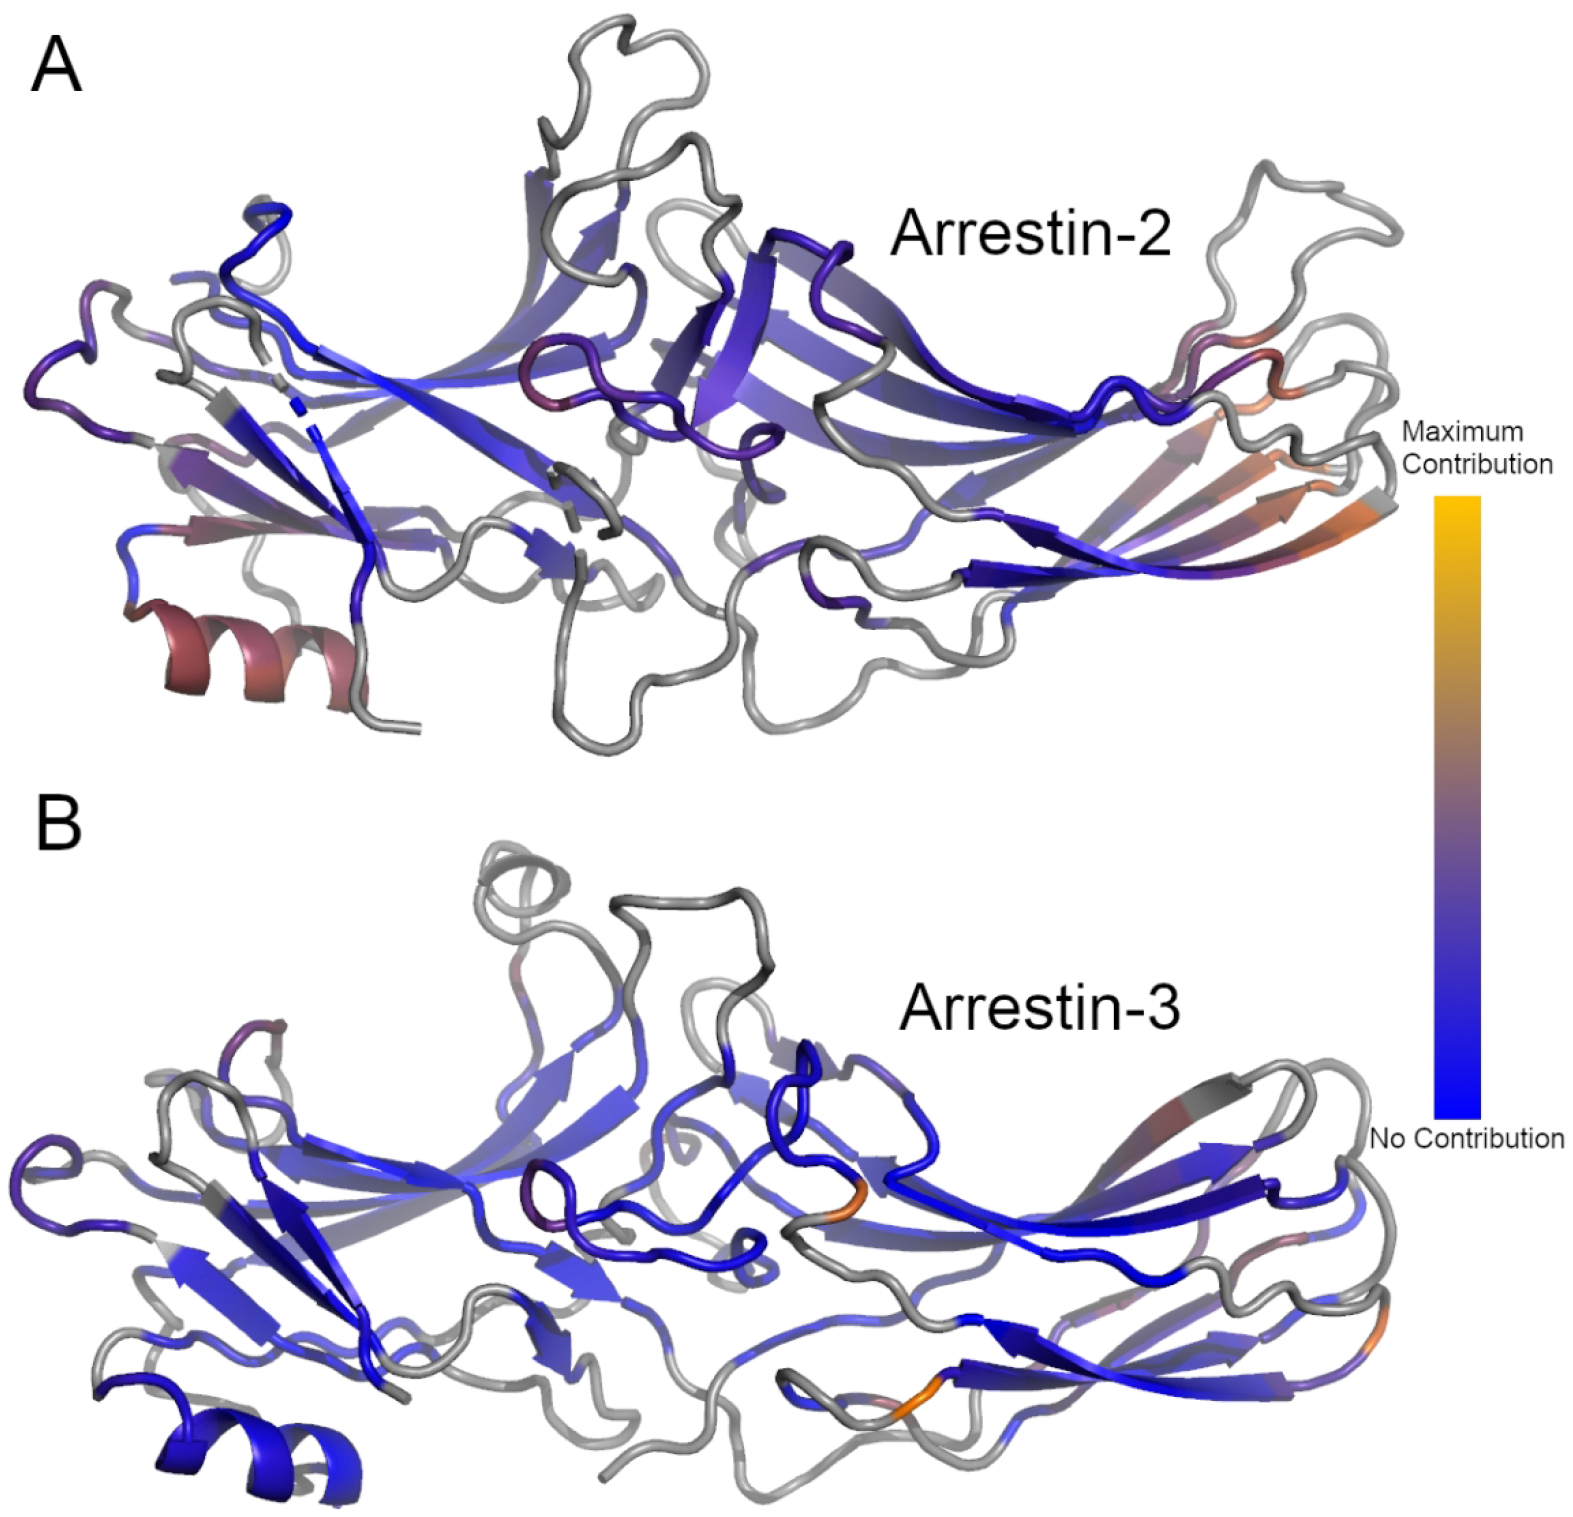
Figure 5:

Average difference in the per-residue dot product between the first mode of all unliganded and peptide-bound structures for Arrestin-2 (A) or Arrestin-3 (B). Gray regions represent structural elements not included in the ANM model. Blue regions represent regions which did not contribute to the differences in the dot product, orange regions represent regions of maximal contribution.
