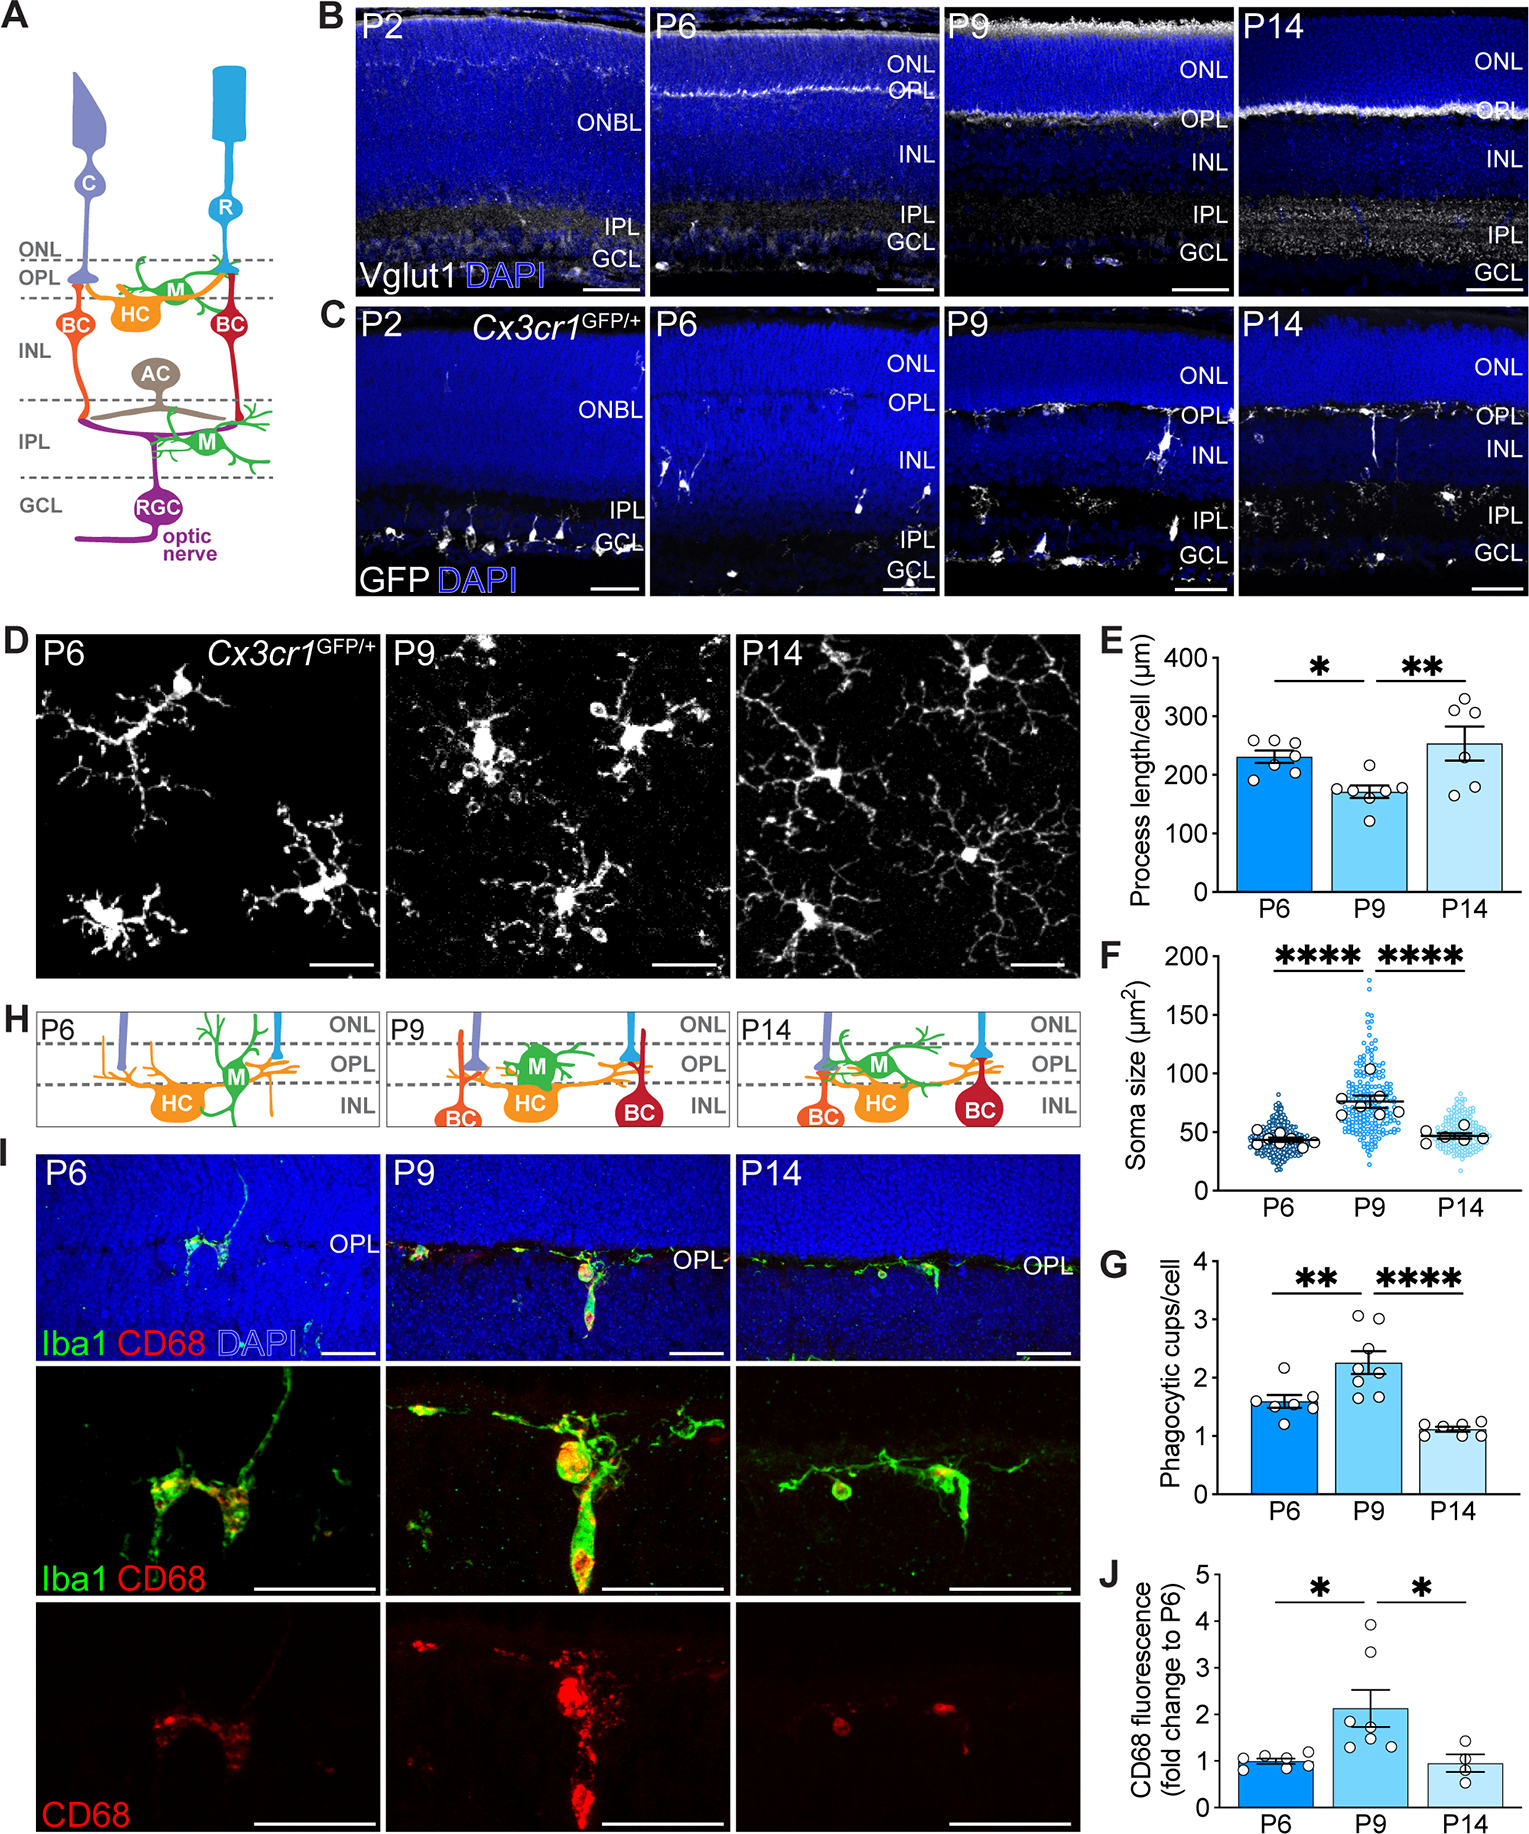
Figure 1. Retinal neuron refinement coincided with heightened microglia phagocytosis.

(A) Schematic of adult retina. Rods (R) and cones (C) in the outer nuclear layer (ONL) synapse onto bipolar cells (BC) and horizontal cells (HC) in the inner nuclear layer (INL), forming a thin synaptic band called outer plexiform layer (OPL). Bipolar cells and amacrine cells (AC) relay signals to retinal ganglion cells (RGC) in the inner plexiform layer (IPL). RGCs reside in the ganglion cell layer (GCL), and their axons form the optic nerve which projects to the brain. Microglia (M) occupy the synaptic layers.
(B) Generation of retinal synaptic layers. Vglut1-labeled inner retina synapses (white) were present at P2. At P5-P6, Vglut1+ photoreceptor terminals were visible in the OPL. At P9, both layers continued to be refined. Synaptogenesis largely completed by P14. Scale bars, 50 μm.
(C) Microglia (white) migration to the synaptic layers. Scale bars, 50 μm.
(D) Representative wholemount images of P6, P9, and P14 OPL microglia in Cx3cr1GFP/+ mice. Scale bars, 25 μm.
(E-G) Developmental time course of wildtype (WT) microglial morphology. Quantifications of process length (E), process endpoints (F), and number of phagocytic cups per microglia (G). n=7 for P6, n=7 for P9, n=6 for P14. Data were compared using one-way ANOVA with posthoc Bonferroni correction.
(H) Schematic of OPL synaptogenesis.
(I) Representative retinal cross-sections showing WT P6, P9, and P14 Iba1+ OPL microglia (green), CD68+ lysosomes (red), and merge (yellow). Scale bars, 25 μm.
(J) Quantification depicting the percentages of P6, P9, and P14 WT CD68+ microglia. n=7 for P6, n=7 for P9, and n=4 for P14. Data were compared using one-way ANOVA with posthoc Bonferroni correction.
Data from (E) to (J) were pooled from two independent experiments. All data are shown as the mean ± SEM. *p<0.05, **p<0.01, ****p<0.0001. See also Figure S1.
