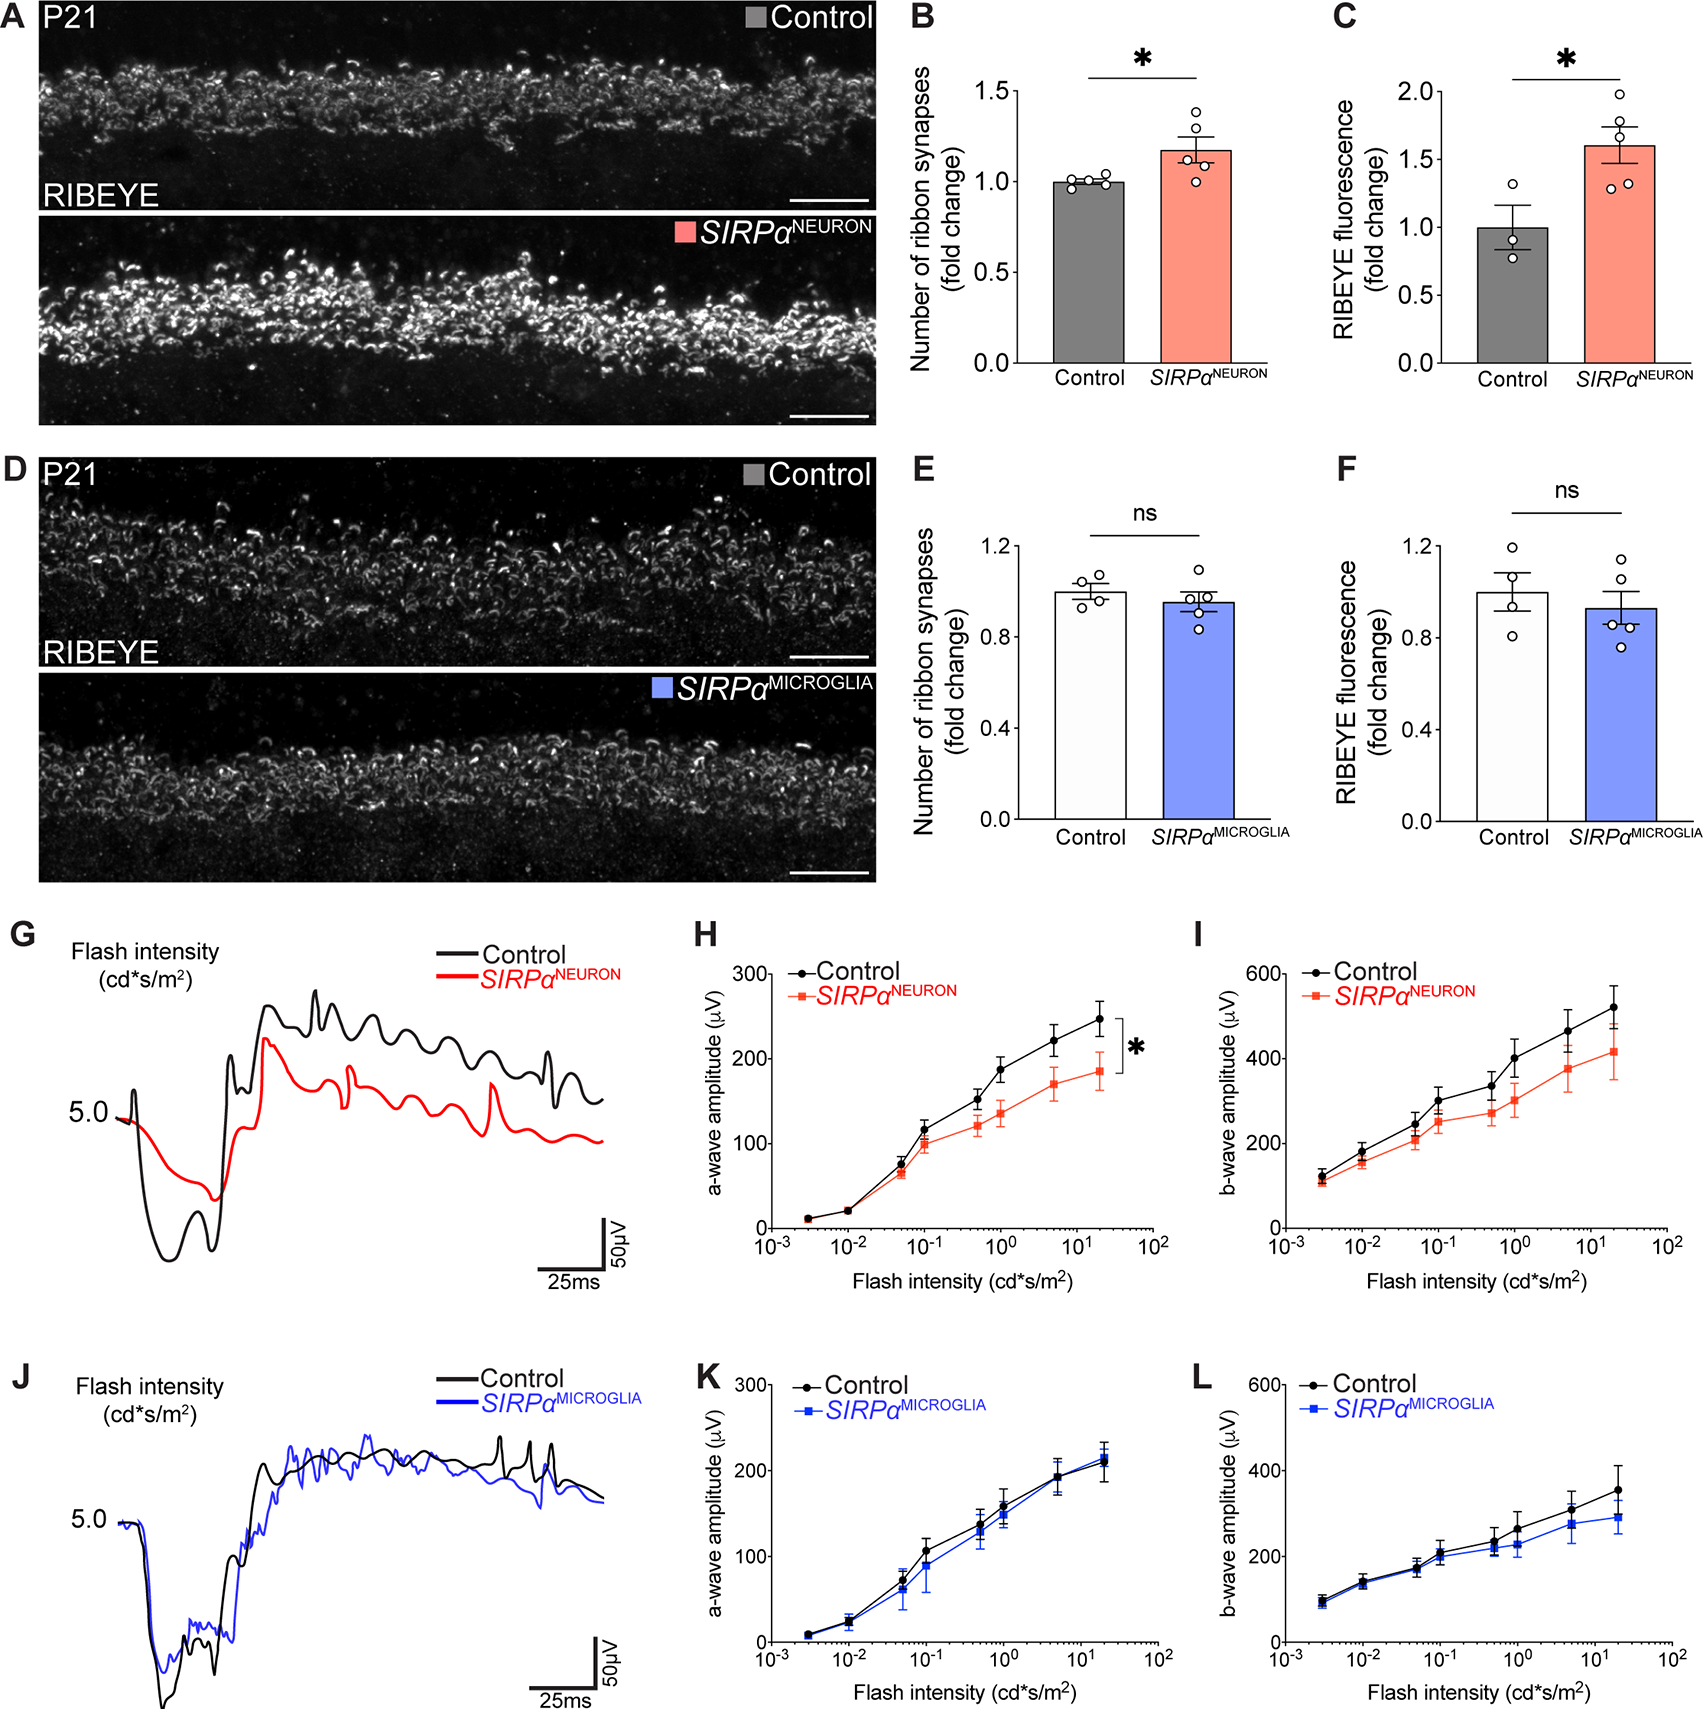
Figure 4. Neuronal SIRPα was required for synapse refinement and circuit function in the retina.

(A) Representative images of RIBEYE+ OPL ribbon synapses in control and SIRPαNEURON retinas. Scale bars, 10 μm.
(B-C) Graphs depicting the number of OPL ribbon synapses (B) and RIBEYE intensity (C) in P9 SIRPαNEURON mice relative to controls. n=5 per group, unpaired t-test.
(D) Representative images of RIBEYE-labeled OPL ribbon synapses in control and SIRPαMICROGLIA retinas. Scale bars, 10 μm.
(E-F) Graphs depicting the number of OPL ribbon synapses (E) and RIBEYE intensity (F) at P9 in SIRPαMICROGLIA mice relative to controls. n>4 per group, unpaired t-test.
(G) Representative traces of scotopic recording from control and SIRPαNEURON mice.
(H and I) Quantifications of the amplitudes of the scotopic a-wave and b-wave in control and SIRPαNEURON mice. n=7 per group, paired t-test.
(J) Representative traces of scotopic recording from control and SIRPαMICROGLIA mice.
(K and L) Quantifications of the amplitudes of the scotopic a-wave and b-wave in control and SIRPαMICROGLIA mice. n=7 per group, paired t-test.
Data were obtained from two to three independent experiments. All data are presented as the mean ± SEM. *p<0.05, ns, not significant.
