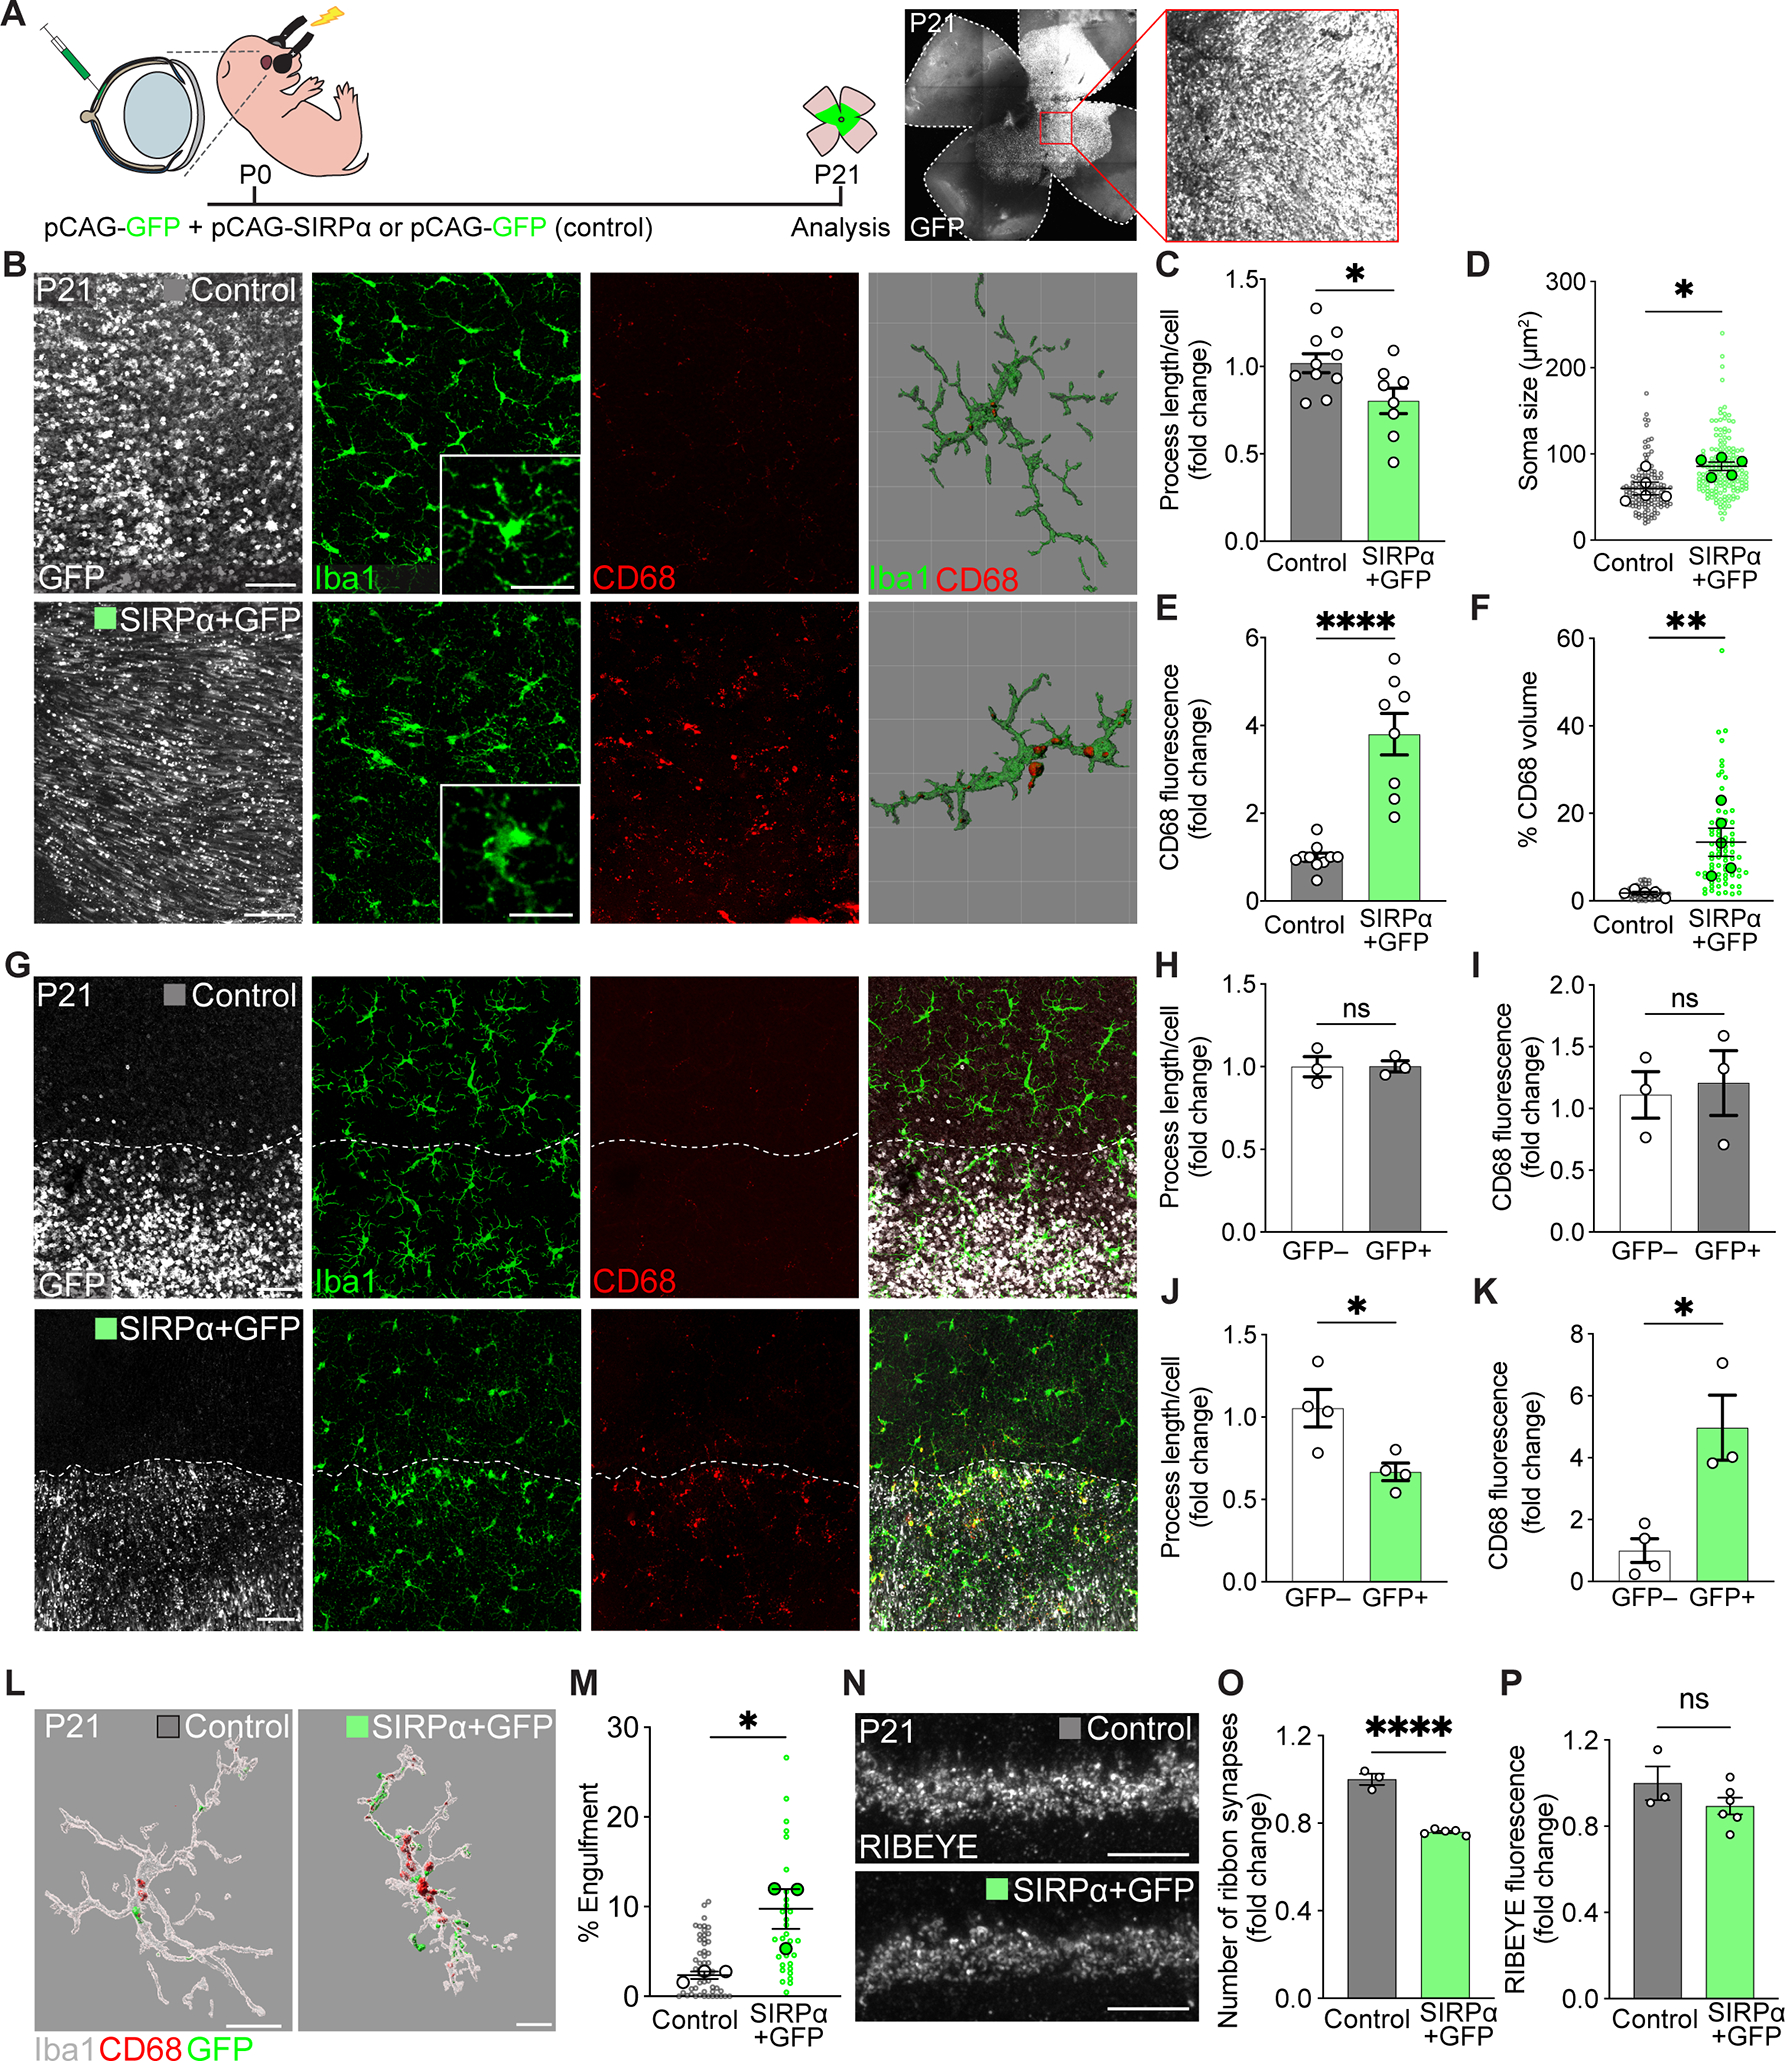
Figure 5. Prolonging neuronal SIRPα expression extended microglia phagocytosis.

(A) Schematic illustration of in vivo electroporation. See also Figure S4A.
(B) Representative confocal and 3D reconstructed images of GFP-expressing cells (white), Iba1+ microglia (green), and CD68+ lysosomes (red) in control (GFP only) and SIRPα+GFP retinas at P21, viewed in wholemount. Scale bars, 50 μm and 25 μm (insets). See also Figure S4B.
(C-D) Quantifications of microglial morphology, including process length (C) and soma size (D), in control and SIRPα+GFP groups. n=10 control, 8 SIRPα+GFP mice, unpaired t-test. (E-F) Quantification of the levels of CD68 staining (E) and internalized CD68+ lysosome volume (F) in SIRPα+GFP versus control groups. n=10 control, 8 SIRPα+GFP mice, unpaired t-test.
(G) Representative confocal images showing borders of the electroporated retinal patch (GFP, white, border indicated by the dotted line), microglia (Iba1, green) morphology, and the levels of CD68 staining (red) in control and SIRPα+GFP regions. Scale bars, 50 μm.
(H-I) Quantifications of microglia process length (H) and CD68 staining levels (I) inside and outside GFP control transfected regions. n=3 per group, unpaired t-test.
(J-K) Quantifications of microglia process length (J) and CD68 staining levels (K) inside and outside SIRPα+GFP transfected regions. n=4 per group, unpaired t-test.
(L-M) Representative 3D-reconstructed images of P21 Iba1+ microglia (gray), internalized GFP-labeled neuronal material (green), and CD68+ lysosomes (red) in control and SIRPα+GFP regions (L), and graph showing percent volume of GFP+ material in microglia from these groups (M). Scale bars, 20 μm. n=3 per group, unpaired t-test.
(N) Representative images of RIBEYE-labeled OPL ribbon synapses in control and SIRPα+GFP groups. Scale bars, 10 μm.
(O-P) Graphs depicting the number of OPL ribbon synapses (O) and RIBEYE intensity (P) in P21 control and SIRPα+GFP groups. n=3 control and 5 SIRPα+GFP mice, unpaired t-test. Data were pooled from at least three independent experiments. All data are presented as the mean ± SEM. *p<0.05, **p<0.01, ****p<0.0001, ns, not significant. See also Figure S4.
