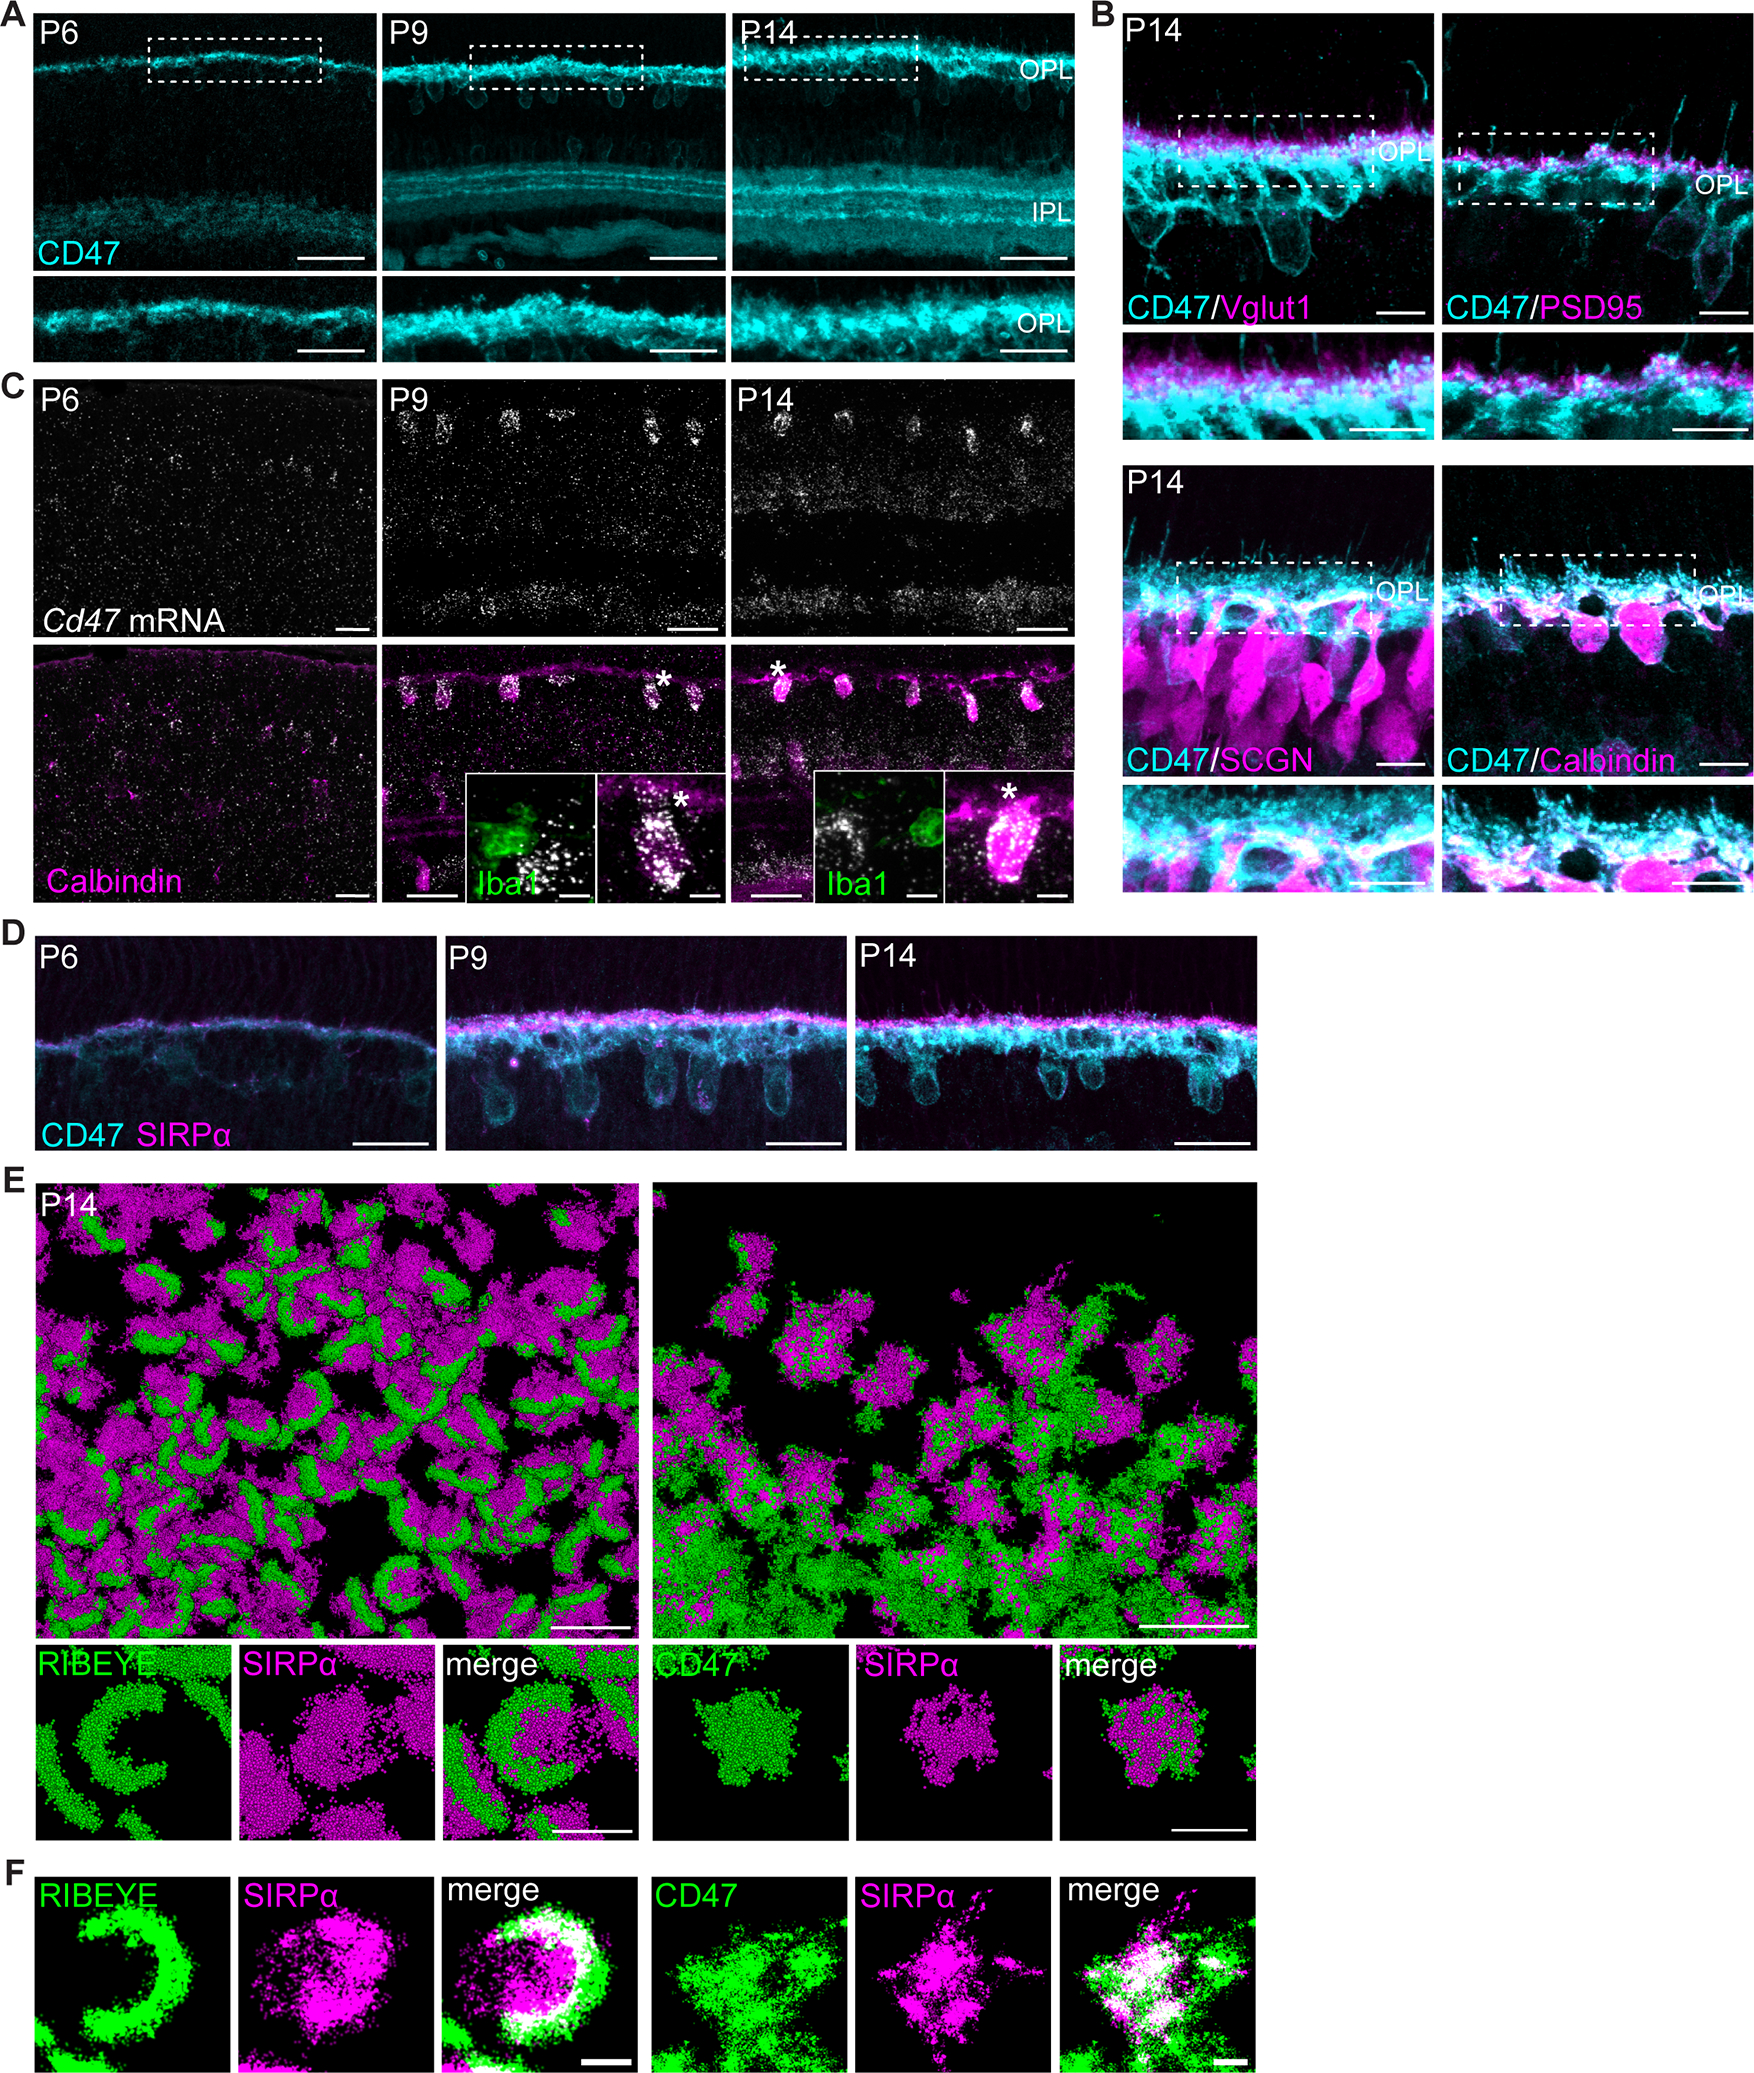
Figure 6. Neuronal SIRPα was juxtaposed with CD47 at synapses during development.

(A) Representative images showing P6, P9, and P14 WT CD47 staining (cyan) in retinal synaptic layers. Scale bars, 50 μm (top) and 25 μm (bottom). See also Figure S5A.
(B) Representative images showing the juxtaposition of CD47 (cyan) with photoreceptor terminals (Vglut1 and PSD95, magenta) as well as colocalization with cone bipolar cell (SCGN) and horizontal cell (Calbindin) terminals (magenta). Scale bars, 10 μm. See also Figure S5B.
(C) Representative images of smFISH for Cd47 mRNA(white) combined with IHC for horizontal cell marker Calbindin (magenta) and microglia marker Iba1 (green). Scale bars, 25 μm and 5 μm (insets). See also Figure S5C.
(D) Representative images showing CD47 colocalization with SIRPα at P6, P9, and P14 in WT retinas. Scale bars, 25 μm.
(E-F) Images showing examples of CD47 colocalization with SIRPα (right) and RIBEYE colocalization with SIRPα (left) in P14 retina using Stochastic Optical Reconstruction Microscopy (STORM). In (F), co-localization between SIRPα and CD47 is depicted in white. Scale bars, 2 μm (top) and 500 nm (bottom).
See also Figure S5.
