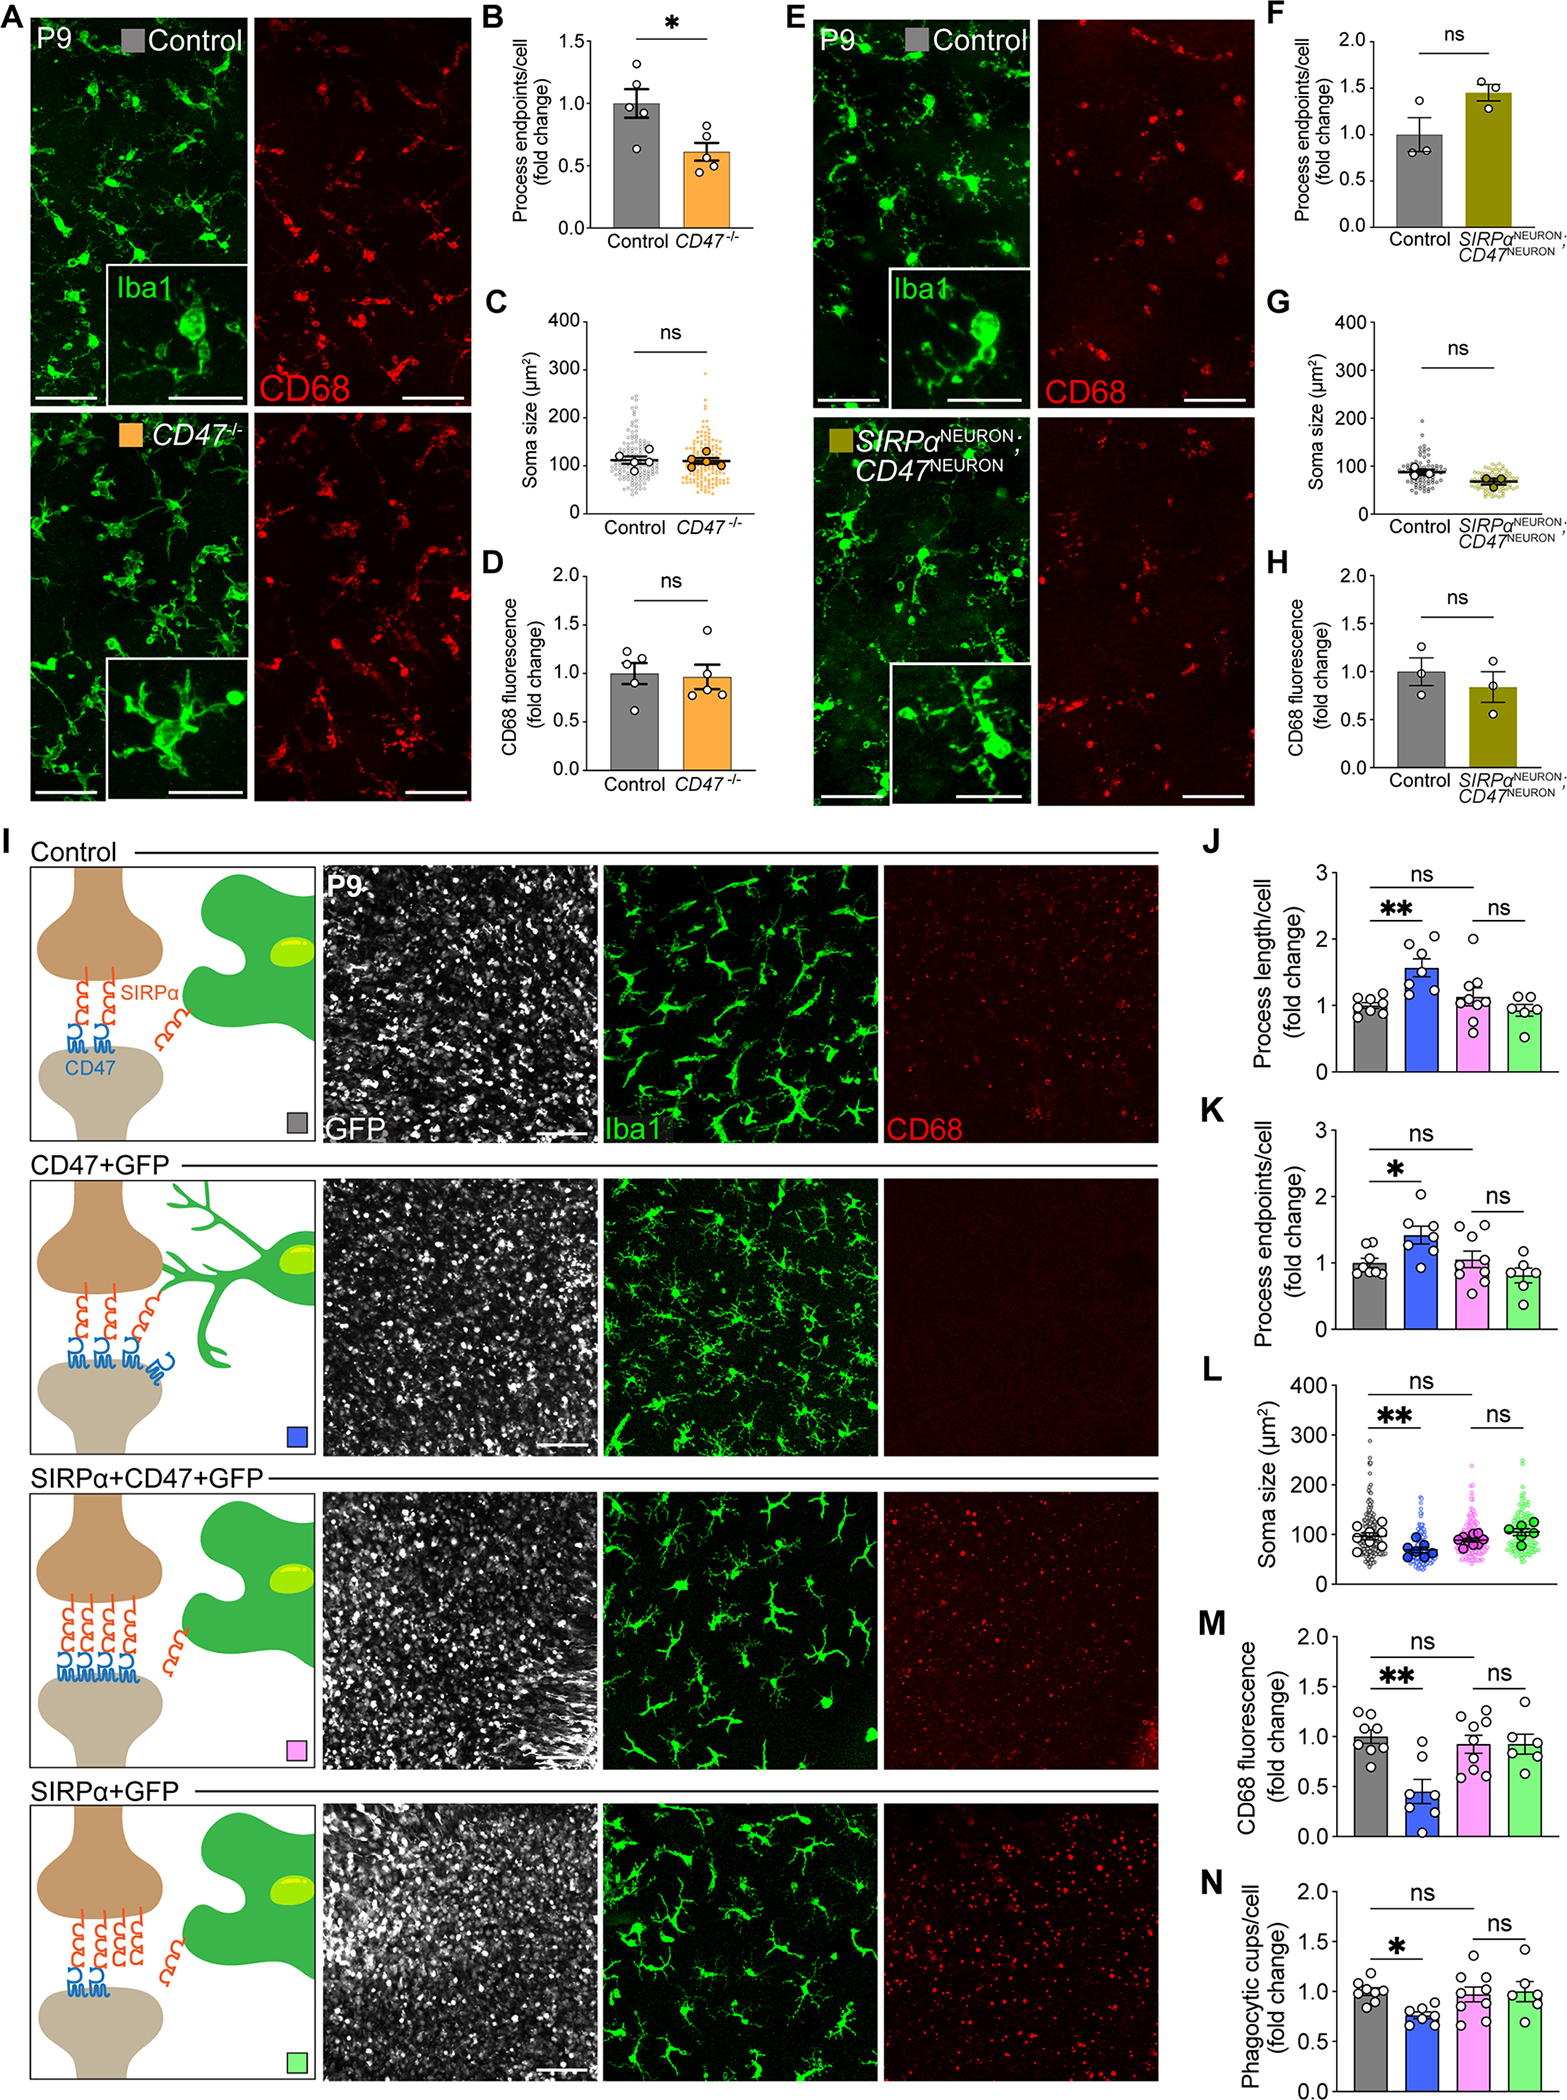
Figure 7. Neuronal SIRPα and CD47 functioned together to limit microglial phagocytosis.

(A) Representative images of Iba1+ microglia (green) and CD68+ lysosomes (red) in control and CD47 knockout mice. Scale bars, 50 μm and 25 μm (insets).
(B-D) Quantifications of microglial morphology and levels of activation, including process endpoints (B), soma size (C), and levels of CD68 staining (D). n=5 per group, unpaired t-test. See also Figure S6A.
(E) Representative images of Iba1+ microglia (green) and CD68+ lysosomes (red) in control and SIRPα/CD47 neuron-specific double knockout mice (SIRPαNEURON; CD47NEURON). Scale bars, 50 μm and 25 μm (insets).
(F-H) Quantifications of microglial morphology and levels of activation, including process endpoints (F), soma size (G), and levels of CD68 staining (H). n=3 per group, unpaired t-test. See also Figure S6B.
(I) Representative confocal images of GFP-expressing cells (white), Iba1-labeled microglia (green), and CD68+ lysosomes (red) in control (GFP only), CD47+GFP, SIRPα+CD47+GFP, and SIRPα+GFP retinas, viewed in wholemount. Scale bars, 50 μm.
(J-N) Quantifications of microglial morphology and CD68 levels, including process length (J), process endpoints (K), soma size (L), levels of CD68 staining (M), and phagocytic cups per cell (N). n=8 control, 9 SIRPα+CD47+GFP, 7 CD47+GFP, and 6 SIRPα+GFP mice, one-way ANOVA with posthoc Bonferroni correction.
Data from (F) to (H) were obtained from one experiment. All other data were pooled from two to three independent experiments. All data are presented as the mean ± SEM. *p<0.05, **p<0.01, ns, not significant. See also Figure S6.
