. 2022 Aug 16;306(1):279–287. doi: 10.1148/radiol.220158

Figure 2:

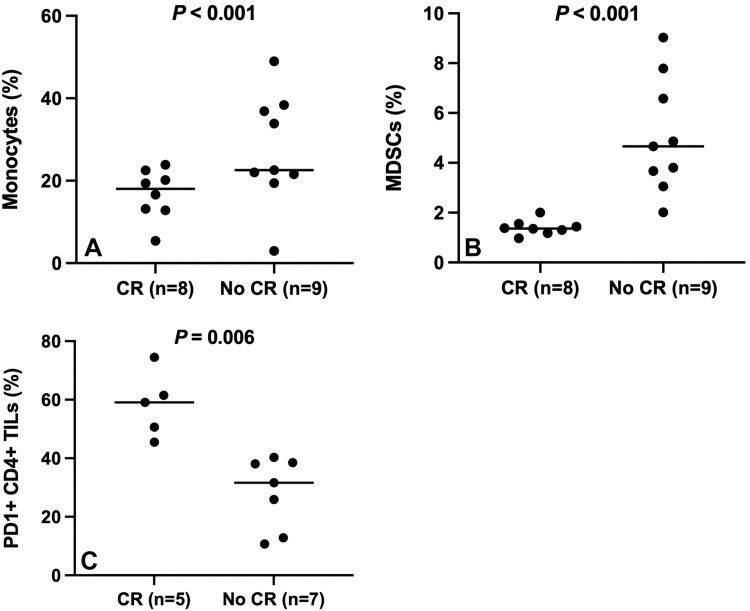
Baseline immune cell levels by response status. Plots show (A) monocyte, (B) myeloid-derived suppressor cell (MDSC), and (C) programmed cell death protein 1 (PD1)–positive CD4+ tumor-infiltrating lymphocyte (TIL) values by response status. The horizontal lines represent the means. CR = complete response.

Baseline immune cell levels by response status. Plots show (A) monocyte, (B) myeloid-derived suppressor cell (MDSC), and (C) programmed cell death protein 1 (PD1)–positive CD4+ tumor-infiltrating lymphocyte (TIL) values by response status. The horizontal lines represent the means. CR = complete response.