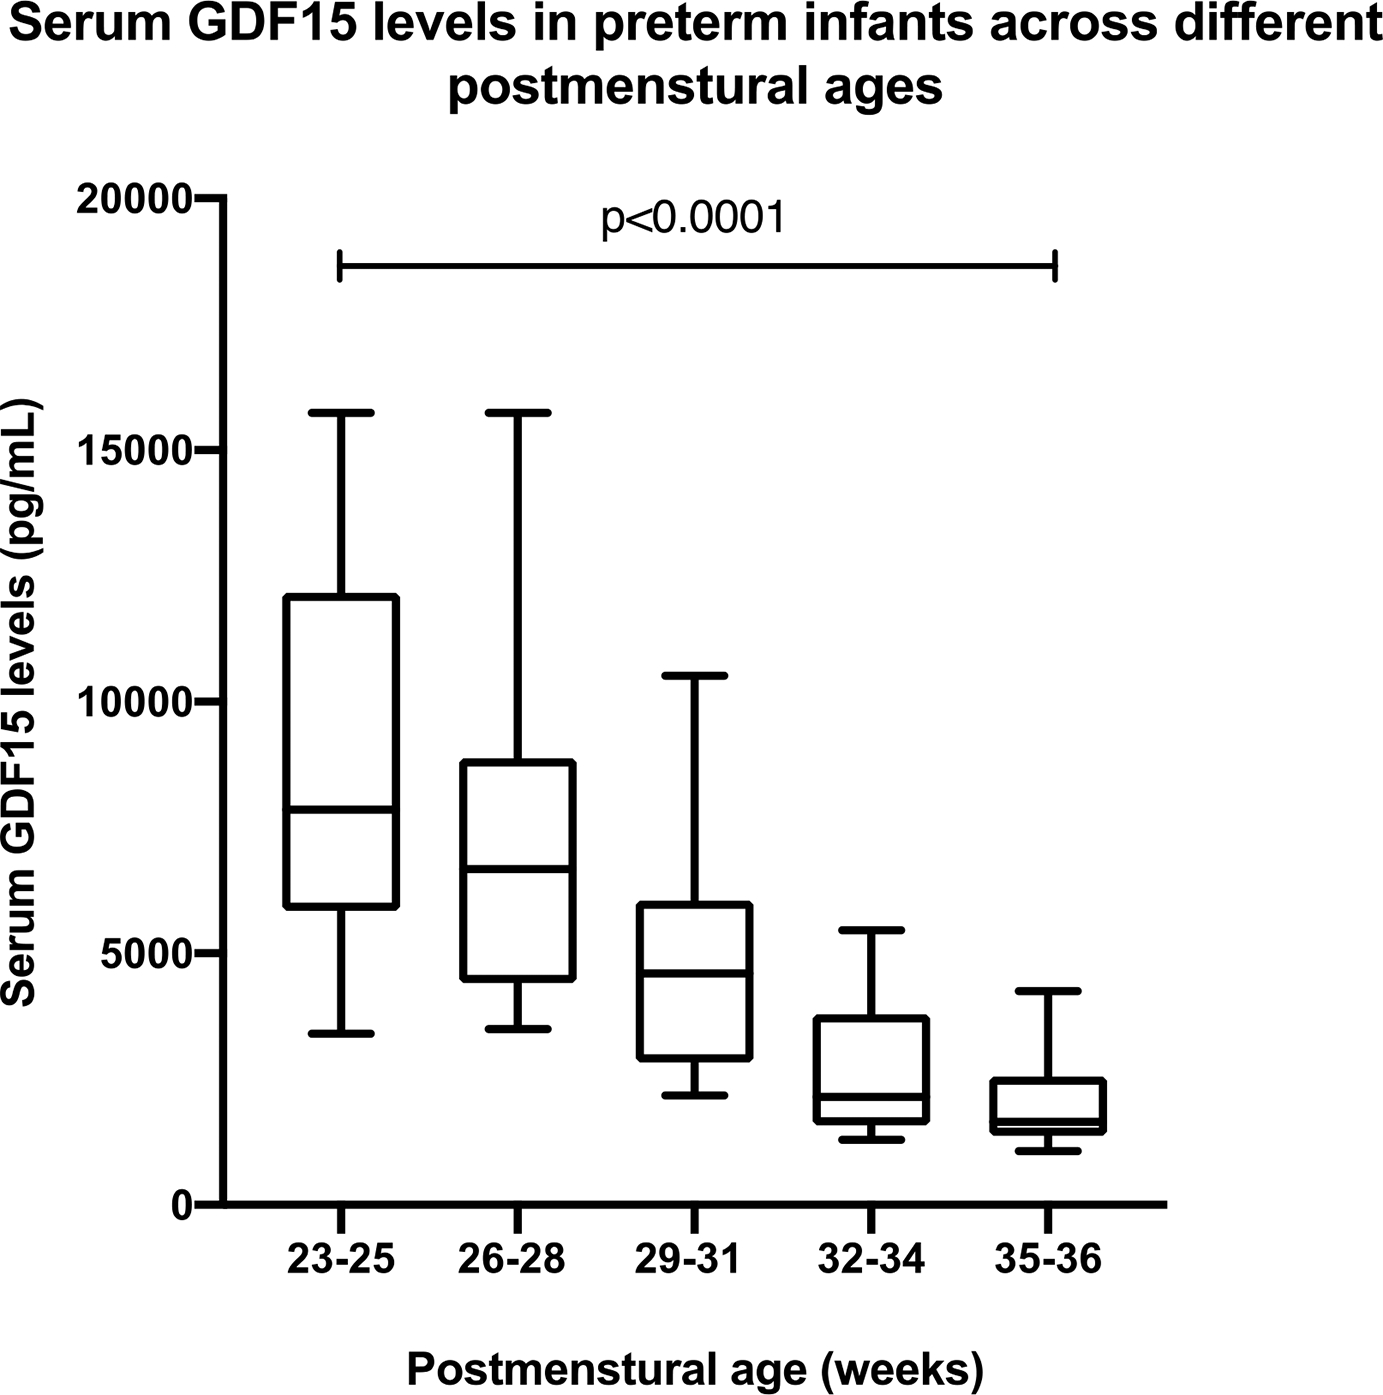
Figure 2:

A box and whisker plot showing the serum GDF15 levels in infants at different postmenstrual ages. The data are represented as boxes for the medians and the interquartile ranges, and the whiskers represent the 10th percentile. Pearson’s correlation showed a significant inverse relationship between PMA and GDF15 level. (r = −0.618, p<0.0001).
