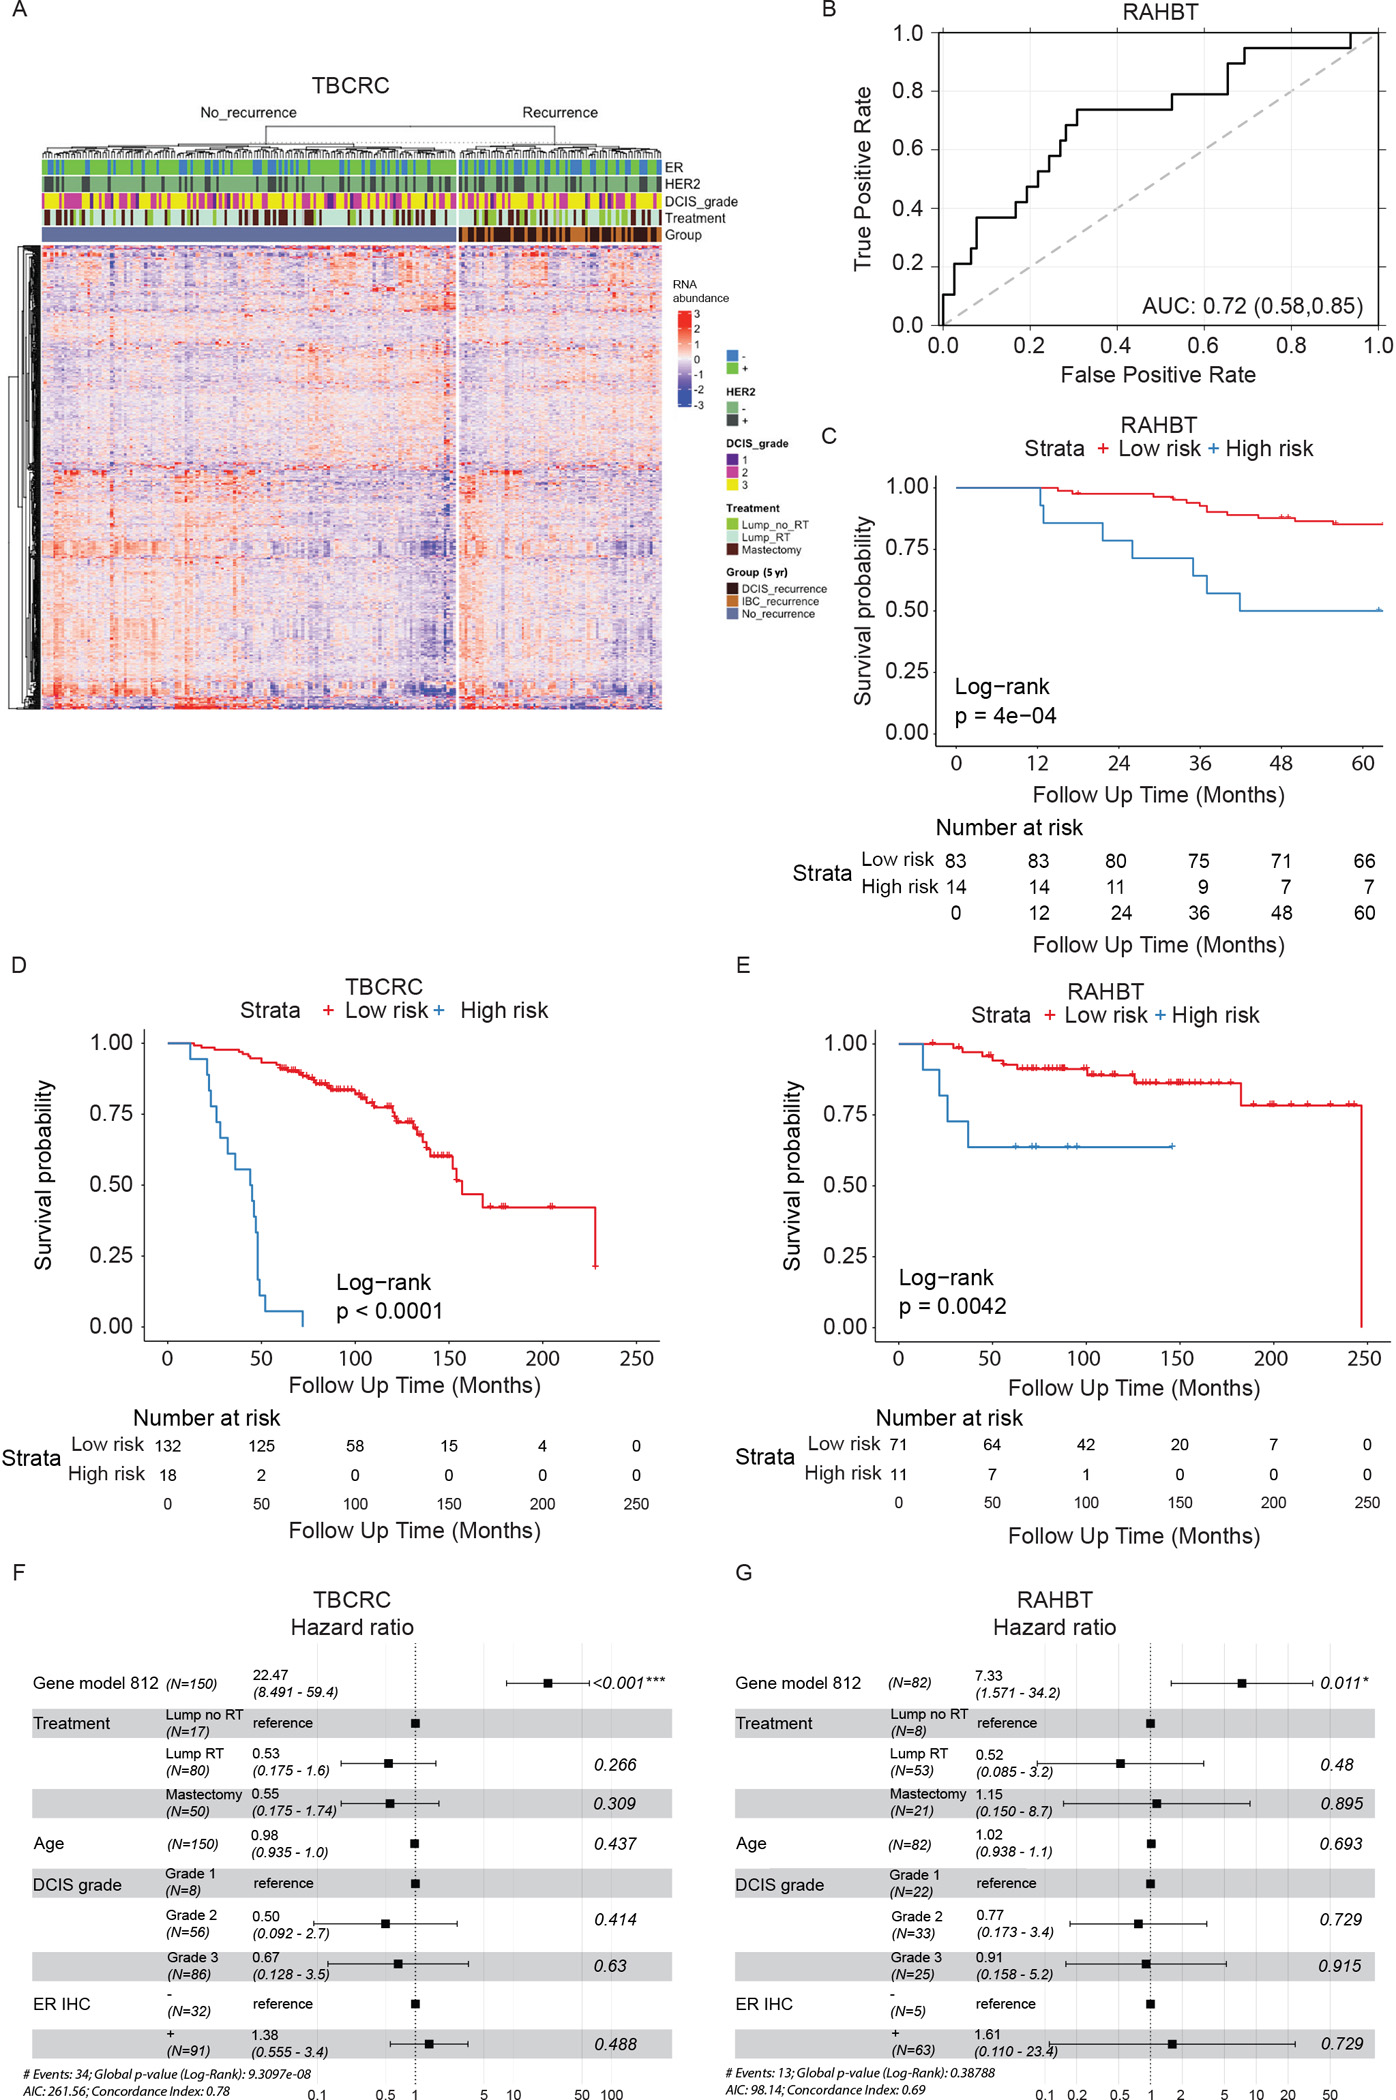
Figure 2. Identification, training, and validation of 812 gene classifier.

A) Heatmap of 812 differentially expressed (DE) genes from cases vs controls analysis (5-year outcome) in TBCRC. Covariates show ER and HER2 status, DCIS grade, treatment, and type of iBE/no iBE. B) ROC curve of the 812 gene classifier in RAHBT. C) Kaplan-Meier plot of time to iBE (5-year outcome) stratified by classifier risk groups in RAHBT. D-E) Kaplan-Meier plot of time to invasive progression (full follow-up) stratified by classifier risk groups in TBCRC (D) and RAHBT (E). C-E) P-values from log-rank tests. F-G) Forest plot of multivariable Cox regression analysis including classifier risk groups, treatment, age, DCIS grade, and ER status for invasive iBEs (full follow-up) in TBCRC (F) and RAHBT (G). See also Figure S1 and Table S3.
