
Figure 3. Outcome-associated pathways in individual samples.
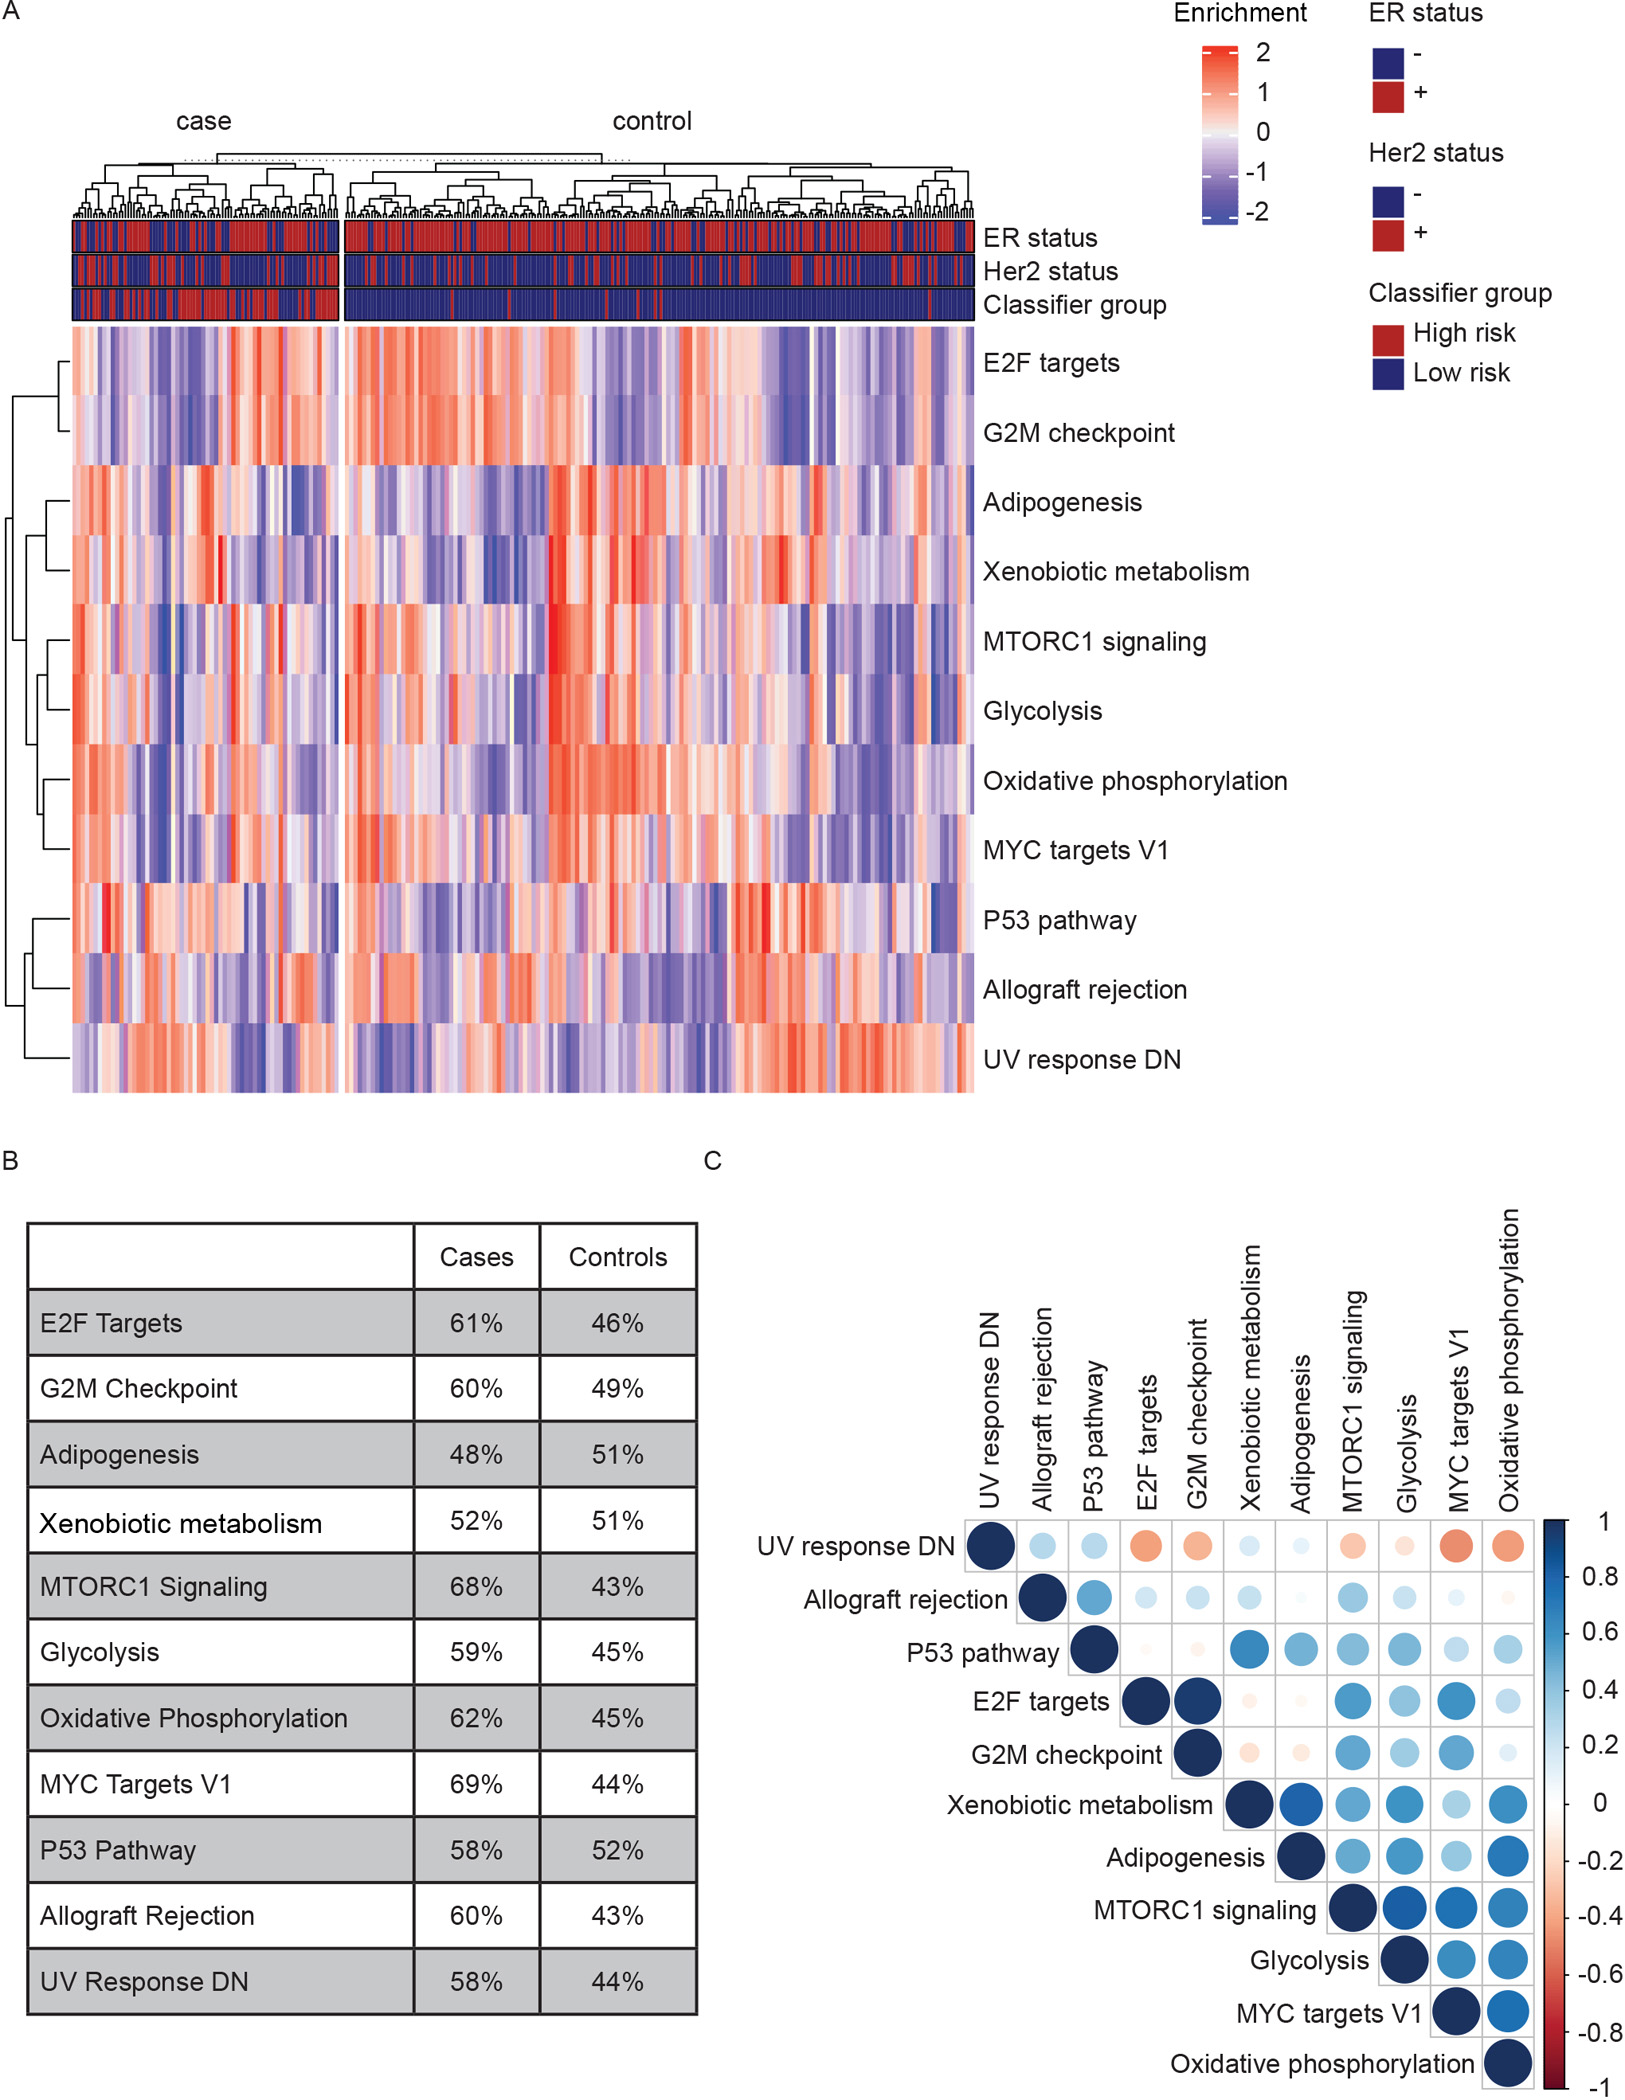
A) Heatmap of single-sample Gene Set Variation Analysis of 11 Hallmark pathways associated with recurrence. B) Percentage of samples in 5-year outcome groups enriched for each pathway in A). C) Plot of Pearson’s correlations between pathways in A). Blue: Positive. Red: Negative. White: P>0.05. Color intensity and circle size are proportional to correlation coefficients.