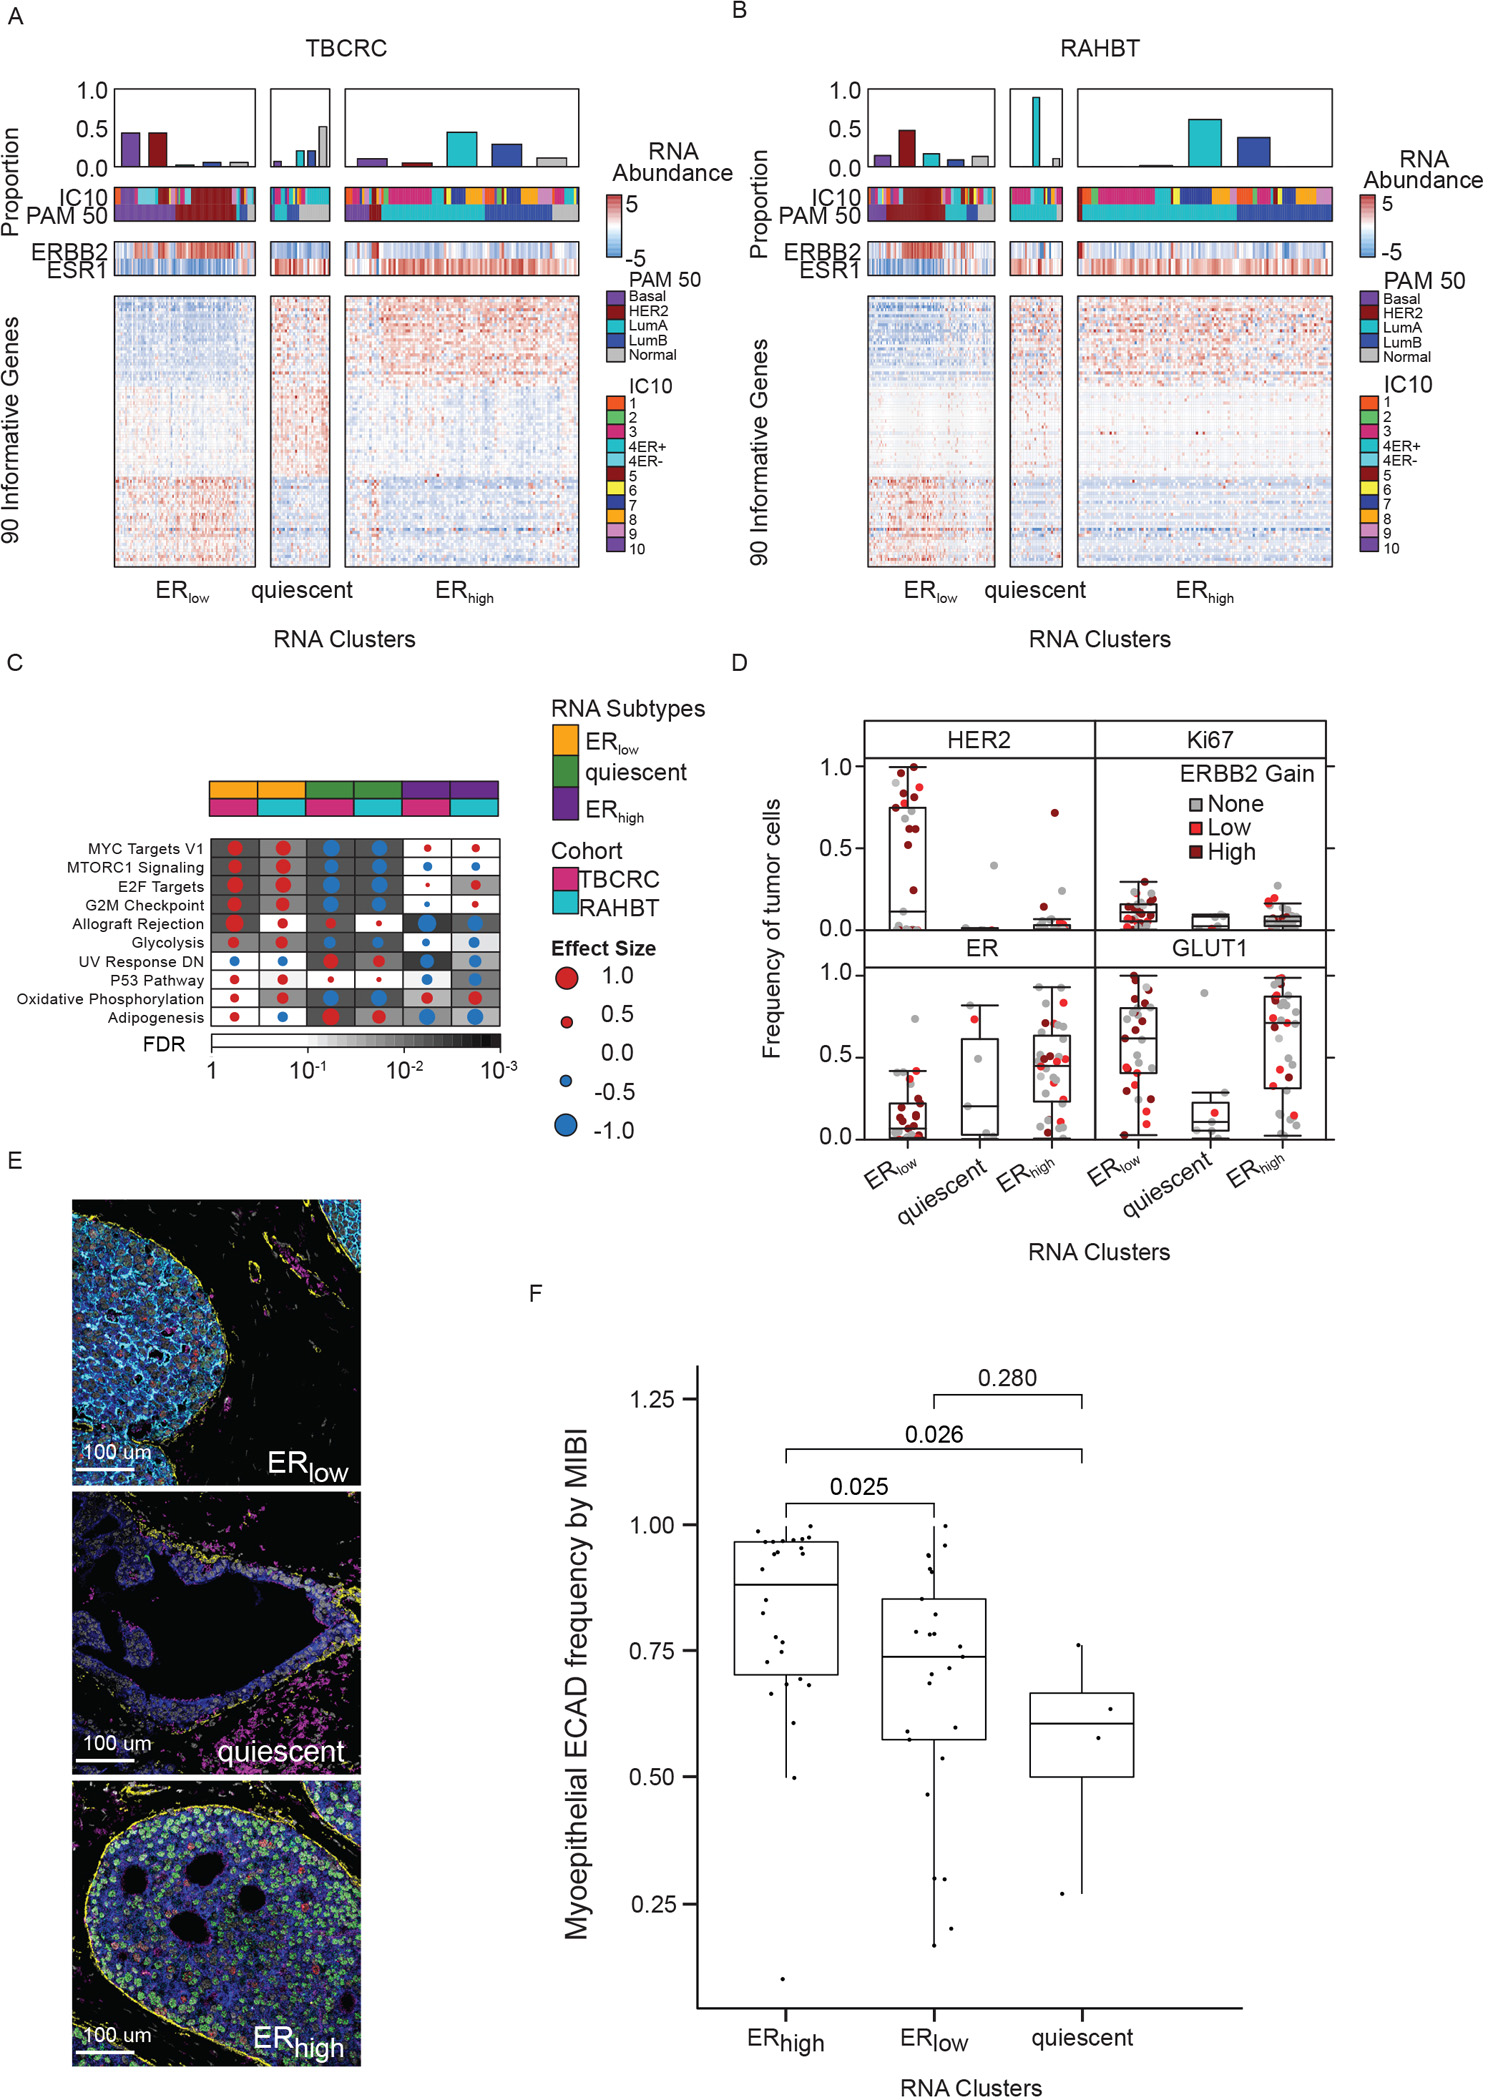
Figure 4. Transcriptomic DCIS subtypes correlate with outcome pathways.

A) Heatmap of 90 informative genes, contributing to the three subtypes in TBCRC samples. Covariates indicate PAM50 and IC subtypes and ERBB2 and ESR1 mRNA abundance for each sample. B) Heatmap of DCIS subtypes in RAHBT. C) Gene Set Enrichment Analysis with Hallmark gene sets of each cluster vs rest for TBCRC and RAHBT LCM (outcome-associated pathways only). Dot size and color indicate magnitude and direction of pathway deregulation. Background shading indicates false discovery rate (FDR). Covariates indicate DCIS subtype and cohort. Effect size and FDR from GSEA algorithm. D) Box plots of HER2, ER, Ki67, and GLUT1 expression by MIBI in DCIS subtypes. Dot color indicates ERBB2 genomic amplification level. E) Representative MIBI images of the three subtypes. White=Nuc; Blue=PanKRT; Yellow=SMA; Pink=GLUT1; Cyan=HER2; Green=ER; Red=Ki67. F) Boxplot of myoepithelial ECAD frequency by MIBI in the three subtypes. P-values from Wilcoxon rank sum test. D, F): Boxplot represents median, 0.25 and 0.75 quantiles with whiskers at 1.5x interquartile range. See also Figure S2.
