
Figure 5. Characteristic IBC CNAs are present in DCIS.
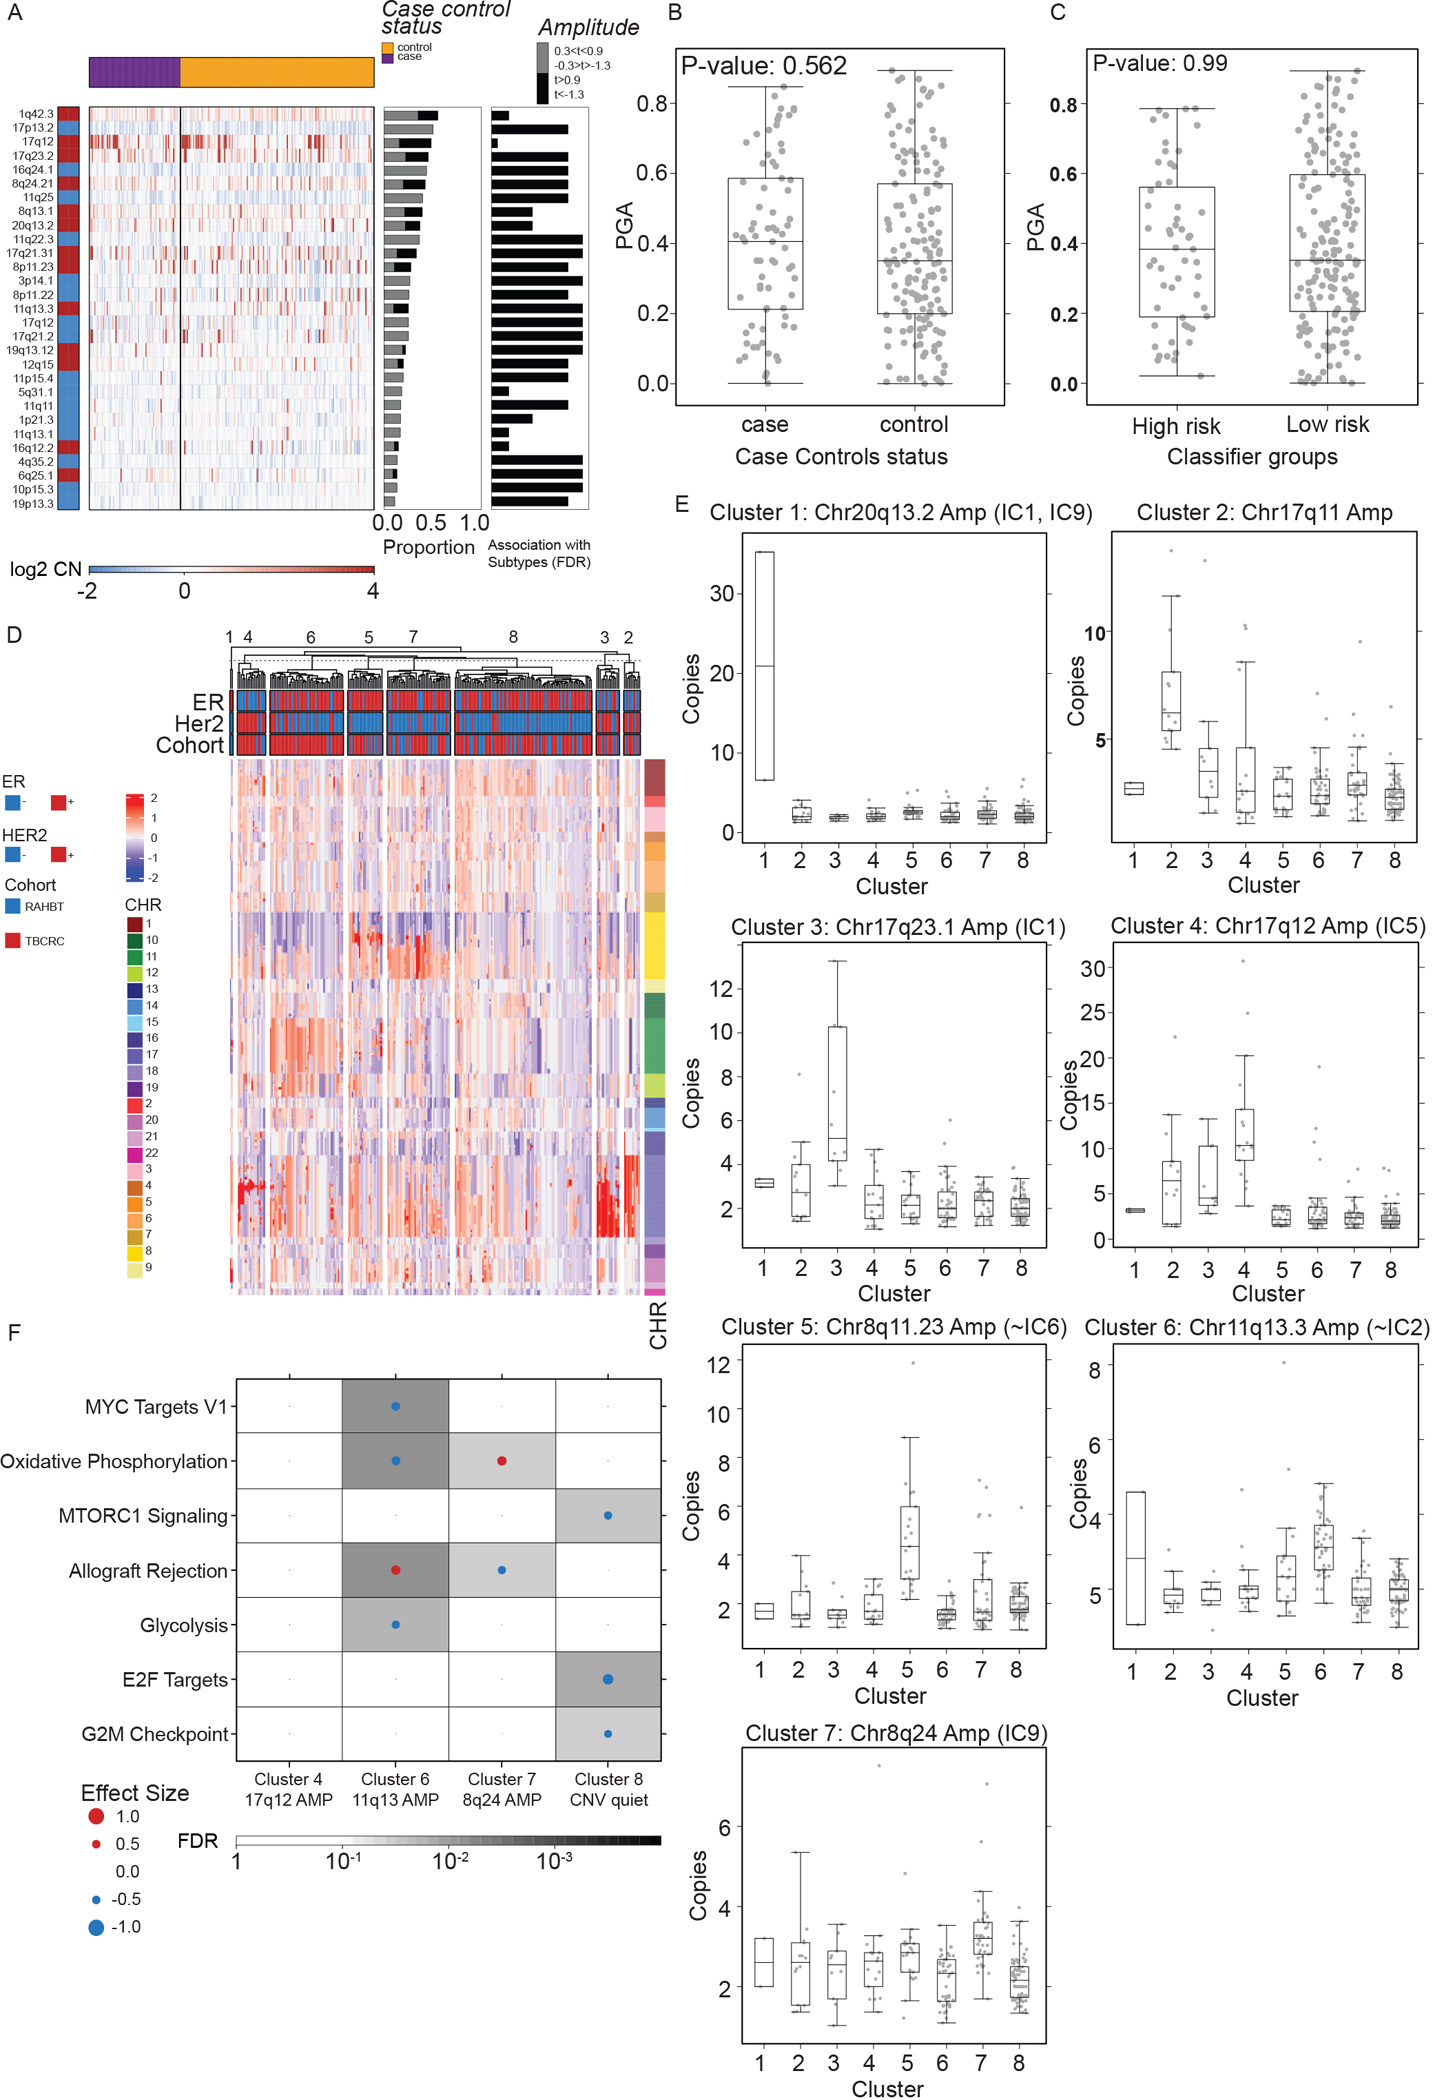
A) Heatmap (log2 copy number) of 29 recurrently altered copy number alterations (CNAs) in each sample grouped by 5-year outcome groups (top bar). Red = gain. Blue = loss. Middle barplot: Proportion of samples with each CNA. Right barplot: FDR from Kruskal-Wallis test of each CNA with outcome groups. B-C) Boxplot showing Proportion of the Genome copy number Altered (PGA) by 5-year outcome groups (B) and classifier risk groups (C). P-values from Kruskal-Wallis test. Boxplot represents median, 0.25 and 0.75 quantiles with whiskers at 1.5x interquartile range. D) Unsupervised clustering of CNA landscape identified eight clusters. Heatmap of genomic segments (log2 copy number) in TBCRC and RAHBT samples. Covariates indicate ER and HER2 status (RNA-derived) and chromosomes for each segment. E) Boxplots of log2 copy numbers across the eight clusters, representing median, 0.25 and 0.75 quantiles with whiskers at 1.5x interquartile range. F) GSEA Hallmark analysis of DE genes in matched RNA samples by DNA cluster for TBCRC and RAHBT, outcome-associated pathways only. Dot size and color represents the magnitude and direction of pathway deregulation. Background shading indicates FDR. Effect size and FDR from GSEA algorithm. See also Figure S3 and Table S4.