
Figure 6. TME analysis.
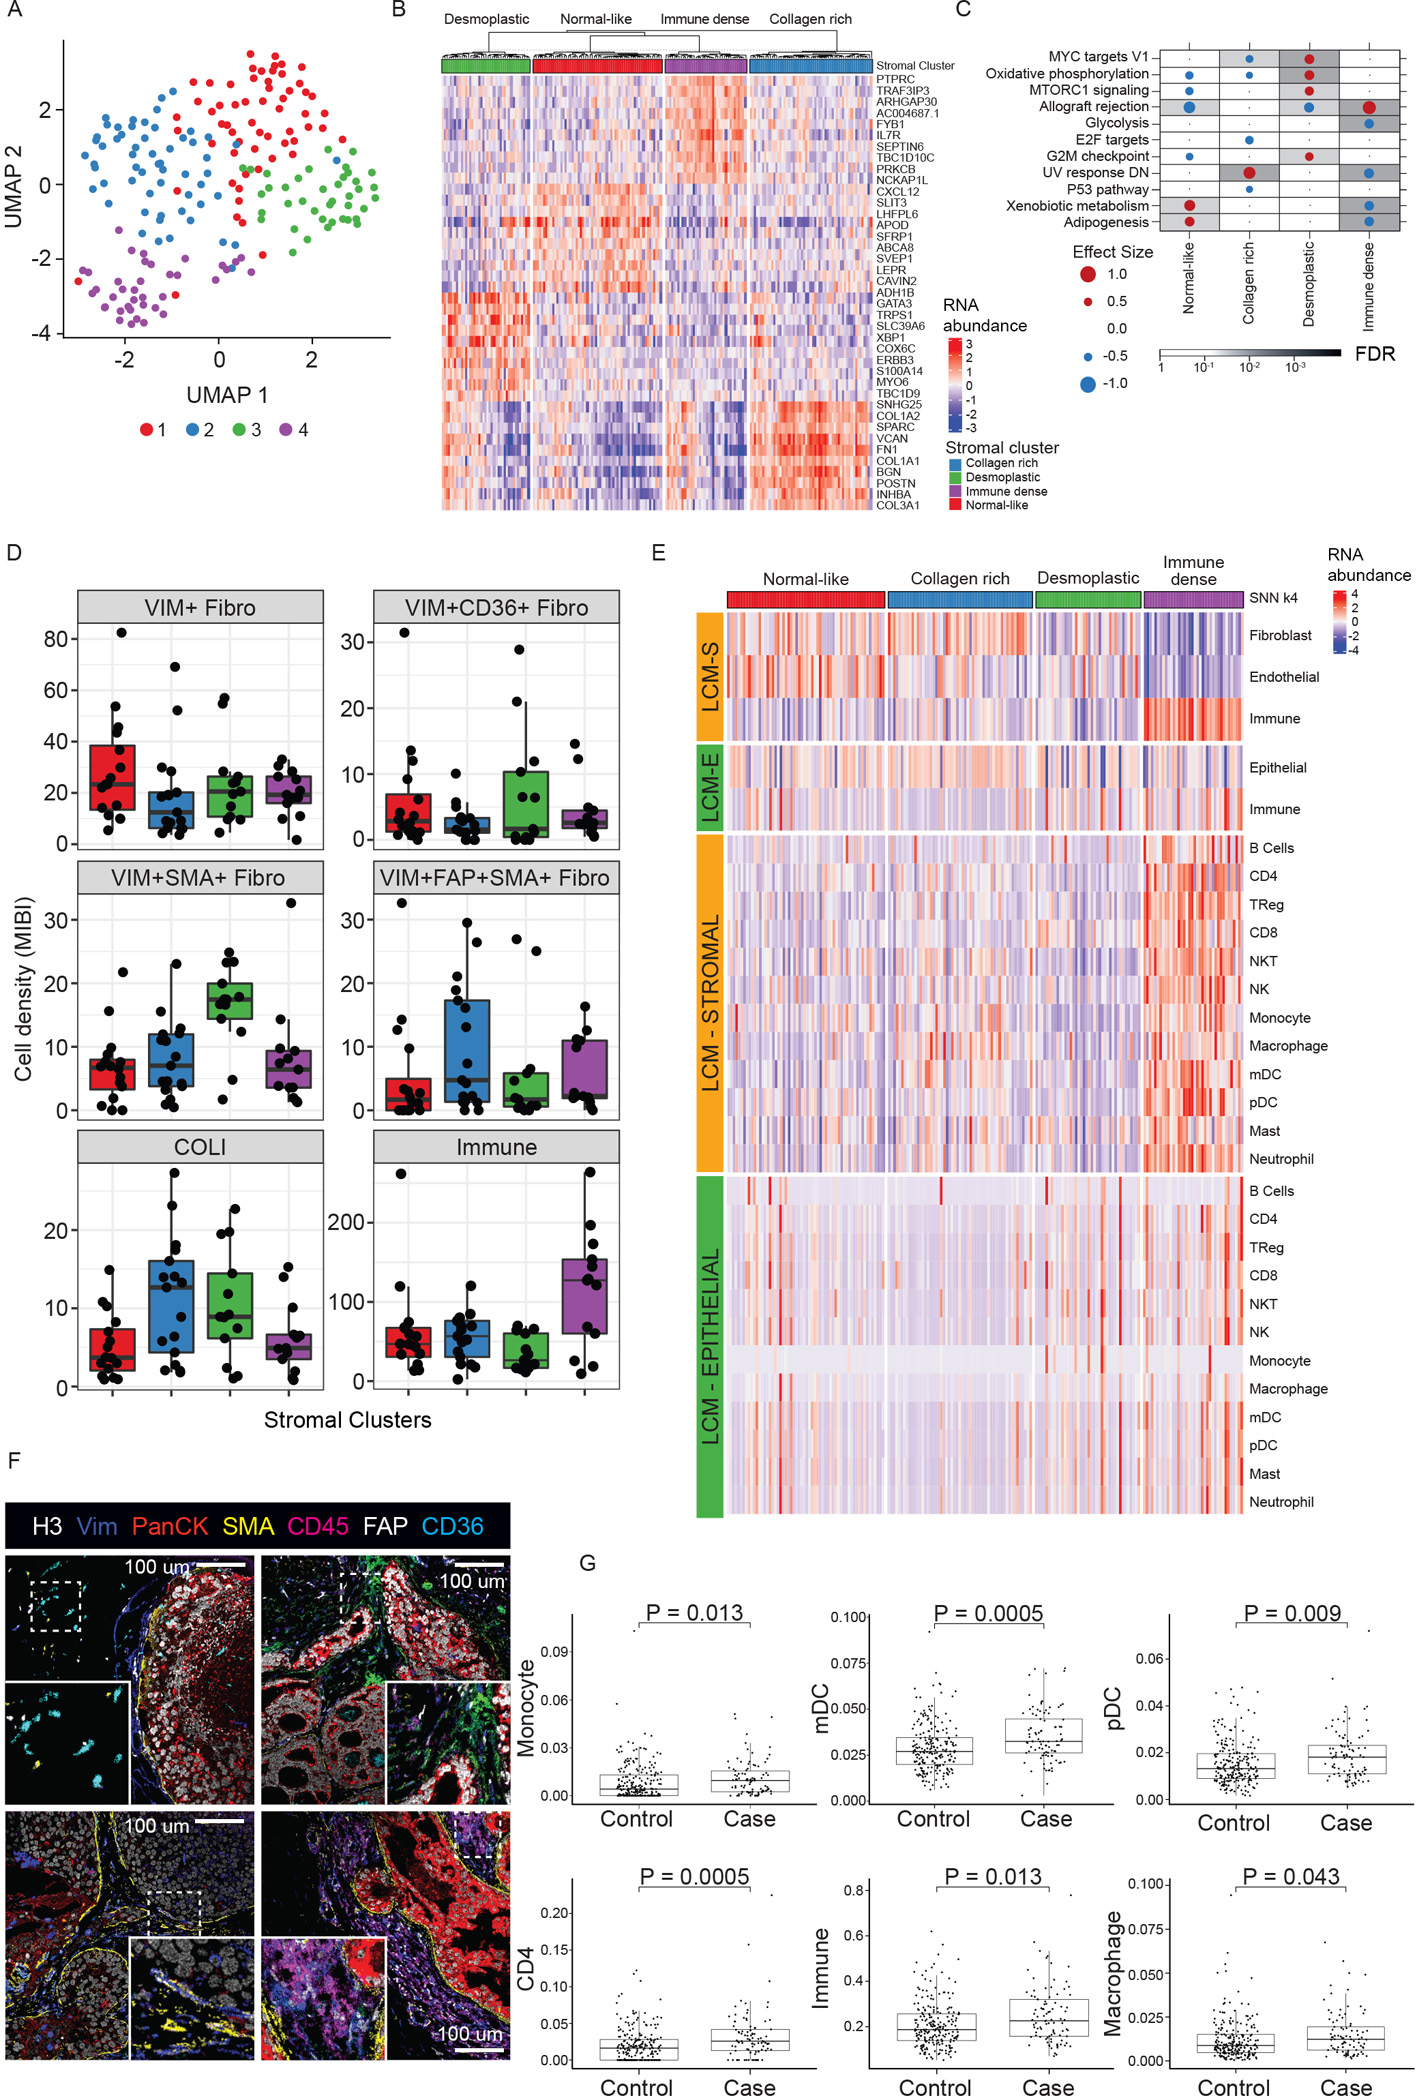
A) UMAP of DCIS stromal transcriptome colored by four identified clusters. B) Heatmap of top 10 up-regulated genes for each stromal cluster. C) GSEA Hallmark analysis of DE genes in each cluster vs rest, outcome-associated pathways only. Dot size and color represents the magnitude and direction of pathway deregulation. Background shading indicates FDR. Effect size and FDR from GSEA algorithm. D) MIBI-estimated cell density within clusters. Boxplot represents median, 0.25 and 0.75 quantiles with whiskers at 1.5x interquartile range. E) Deconvolution analysis by CSx of epithelial and stromal LCM samples grouped by stromal clusters displaying immune cell and fibroblast abundance. F) Representative MIBI images of clusters reflecting different fibroblast states and total immune density. Top left: normal-like. Top right: Collagen rich (FAP+). Bottom left: Desmoplastic (SMA+). Bottom right: Immune dense (CD45 high). H3, histone 3; VIM, vimentin; panCK, pan cytokeratin; SMA, smooth muscle actin; FAP, fibroblast activated protein. G) CSx-inferred cell type distribution between cases with iBEs vs controls, TBCRC and RAHBT combined. Boxplot represents median, 0.25 and 0.75 quantiles with whiskers at 1.5x interquartile range. Only cell types with FDR<0.05 shown (Wilcoxon rank sum test). See also Figures S4–6 and Table S5.