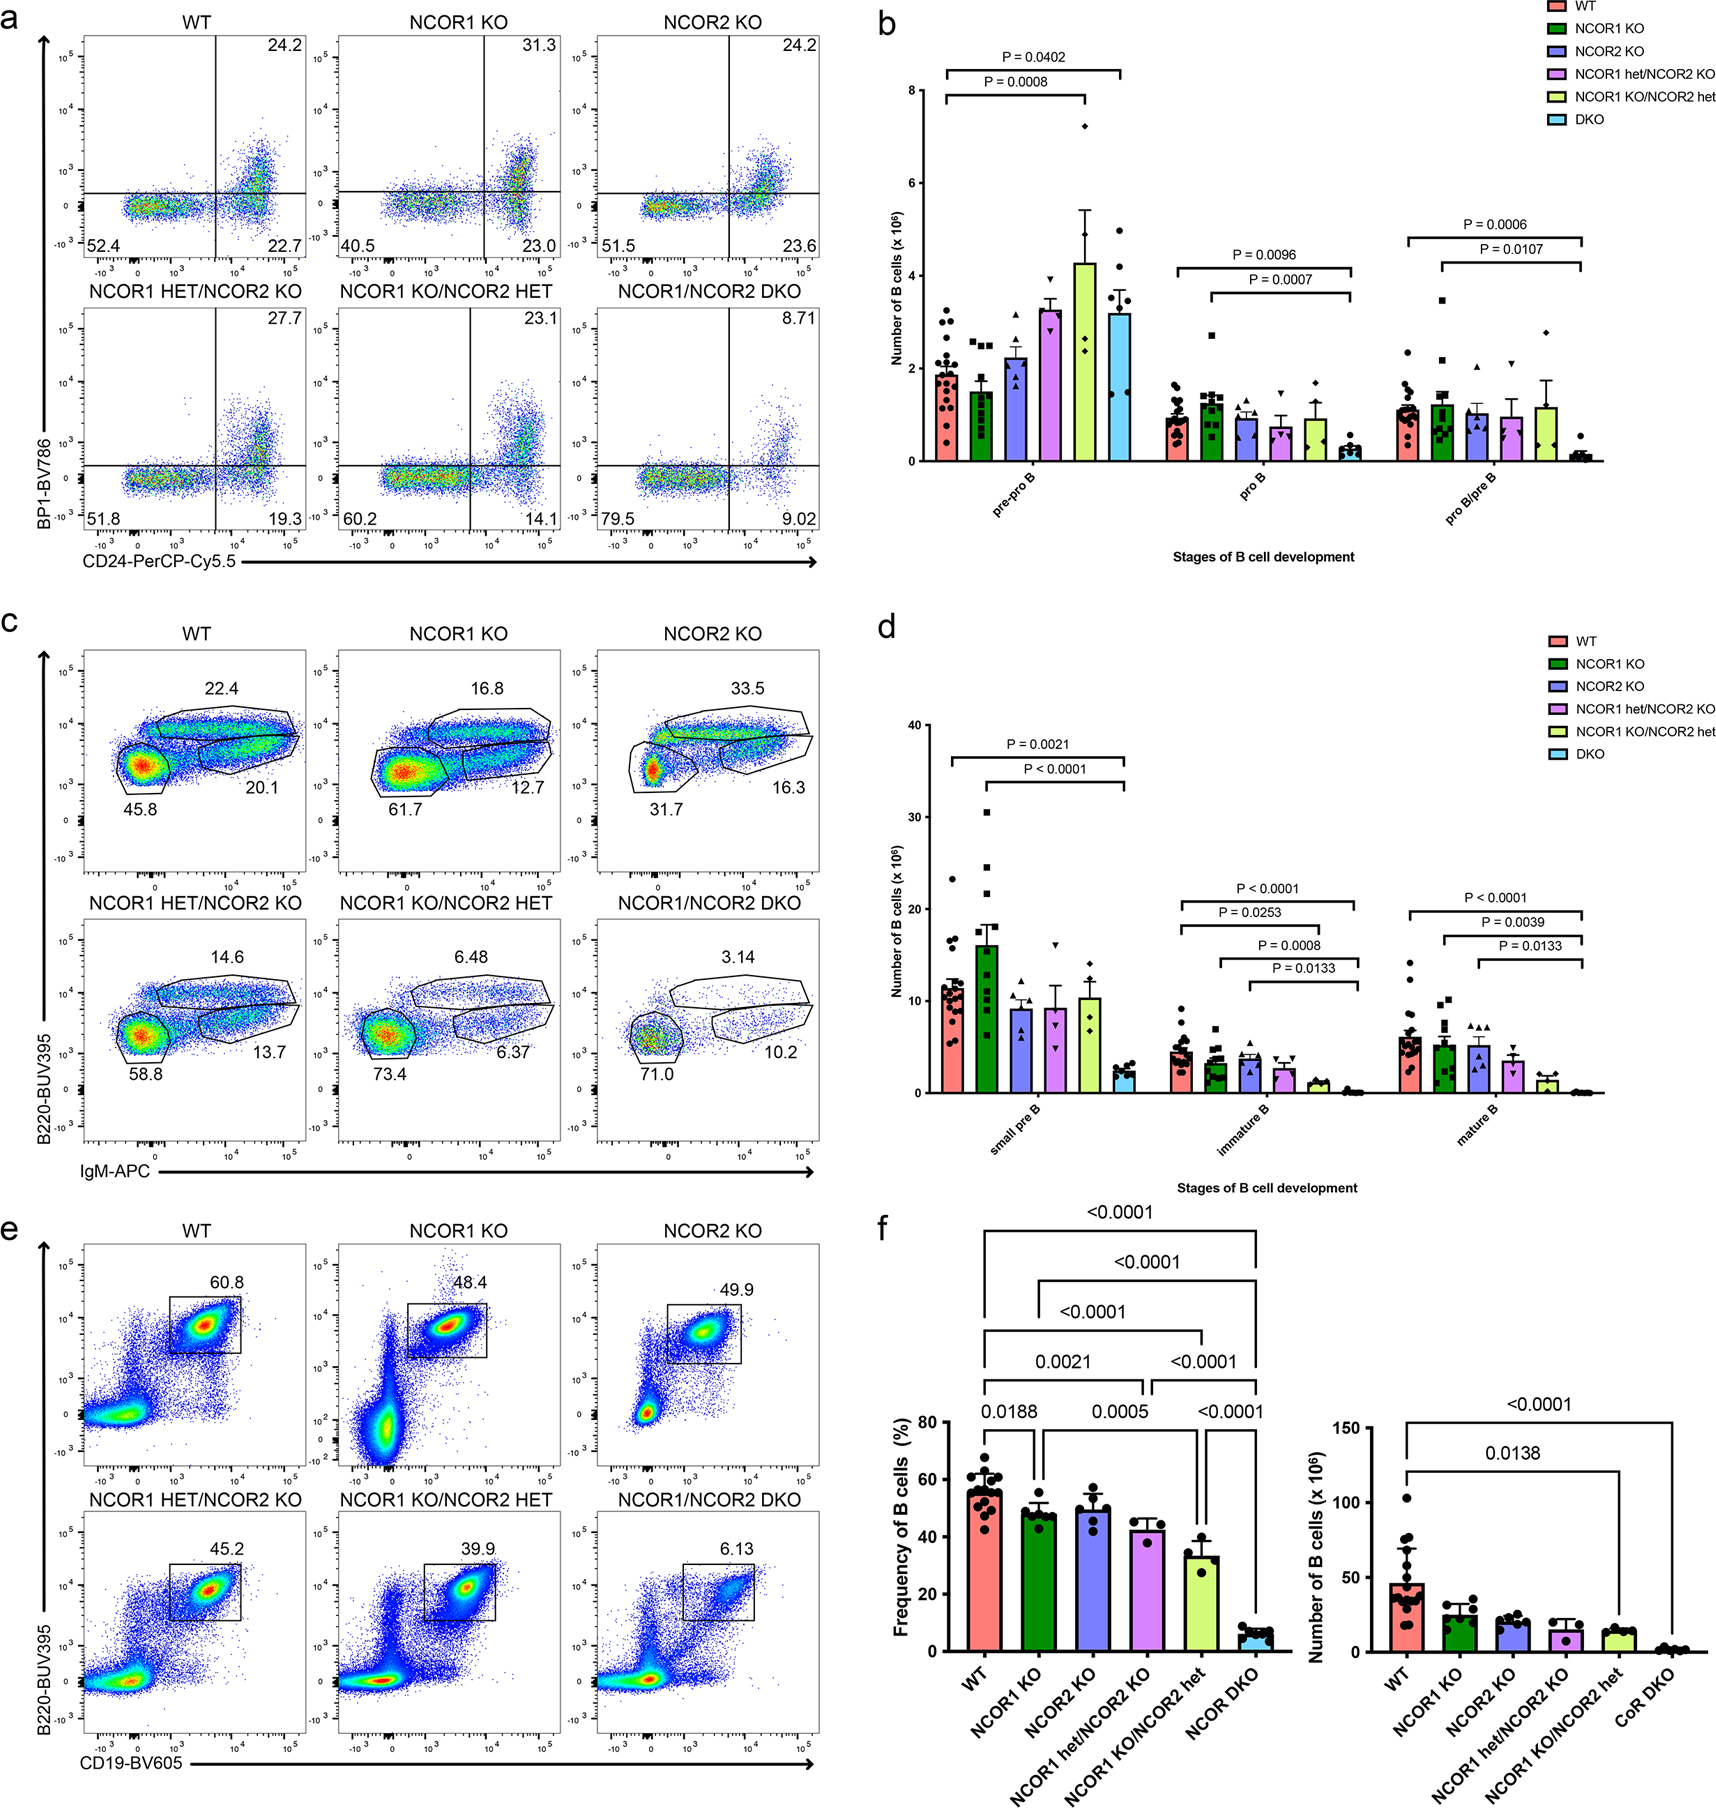
Figure 1. B cell development requires nuclear corepressors NCOR1 and NCOR2 and is sensitive to their gene dosage.

a. Representative flow cytometry plots of pre-pro-B, pro-B and pro-B/pre-B cells in wildtype (WT), NCOR1 KO, NCOR2 KO, NCOR1 het/NCOR2 KO, NCOR1 KO/NCOR2 het, and NCOR1/2 DKO. Cells were pre-gated on B220+CD43+ cells. Numbers in the flow cytometry plot represent the frequency of B220+CD43+ cells. b. Cell number of pre-pro-B, pro-B and pro-B/pre-B cells in the bone marrow among different NCOR knockouts (WT; n=19, NCOR1 KO; n=11, NCOR2 KO; n=6, NCOR1 het/NCOR2 KO; n=4, NCOR1 KO/NCOR2 het; n=4, NCOR1/2 DKO; n=7). An ordinary one-way ANOVA with Tukey’s multiple comparison was performed for the pre-pro-B cell population. A Kruskal-Wallis one-way ANOVA with Dunn’s multiple comparison was performed for the pro-B and pro-B/pre-B populations. c. Representative flow cytometry plots of small pre-B, immature B and mature B cells in different NCOR-knockouts. Numbers in the flow cytometry plot represent the frequency of B220+CD43− cells. d. Cell number of small pre-B, immature B, and mature B in the bone marrow among different NCOR knockouts (n for each genotype is same as in panel b). A Kruskal-Wallis one-way ANOVA with Dunn’s multiple comparison was performed for the small pre-B, immature B and mature B cell populations. e. Representative flow cytometry plots of splenic CD19+B220+ B cells in different NCOR-knockouts. f. Frequency (left) of splenic CD19+B220+ among different NCOR knockouts (WT; n=15, NCOR1 KO; n=7, NCOR2 KO; n=6, NCOR1 het/NCOR2 KO; n=3, NCOR1 KO/NCOR2 het; n=4, NCOR1/2 DKO; n=7) and cell number (right) of splenic CD19+B220+ cells among different knockouts (WT; n=17, NCOR1 KO; n=7, NCOR2 KO; n=6, NCOR1 het/NCOR2 KO; n=3, NCOR1 KO/NCOR2 het; n=4, NCOR1/2 DKO; n=6). An ordinary one-way ANOVA with Tukey’s multiple comparison was performed for statistical analysis of frequency and a Kruskal-Wallis one-way ANOVA with Dunn’s multiple comparison was performed for cell numbers. Number in each flow cytometry gate represents the frequency for the representative sample. Error bars represent standard deviation. All measures of centers indicate mean. Data was obtained from ≥ three independent experiments for all panels.
