
Figure 2. Nuclear corepressors regulate both proliferation and differentiation during B cell development.
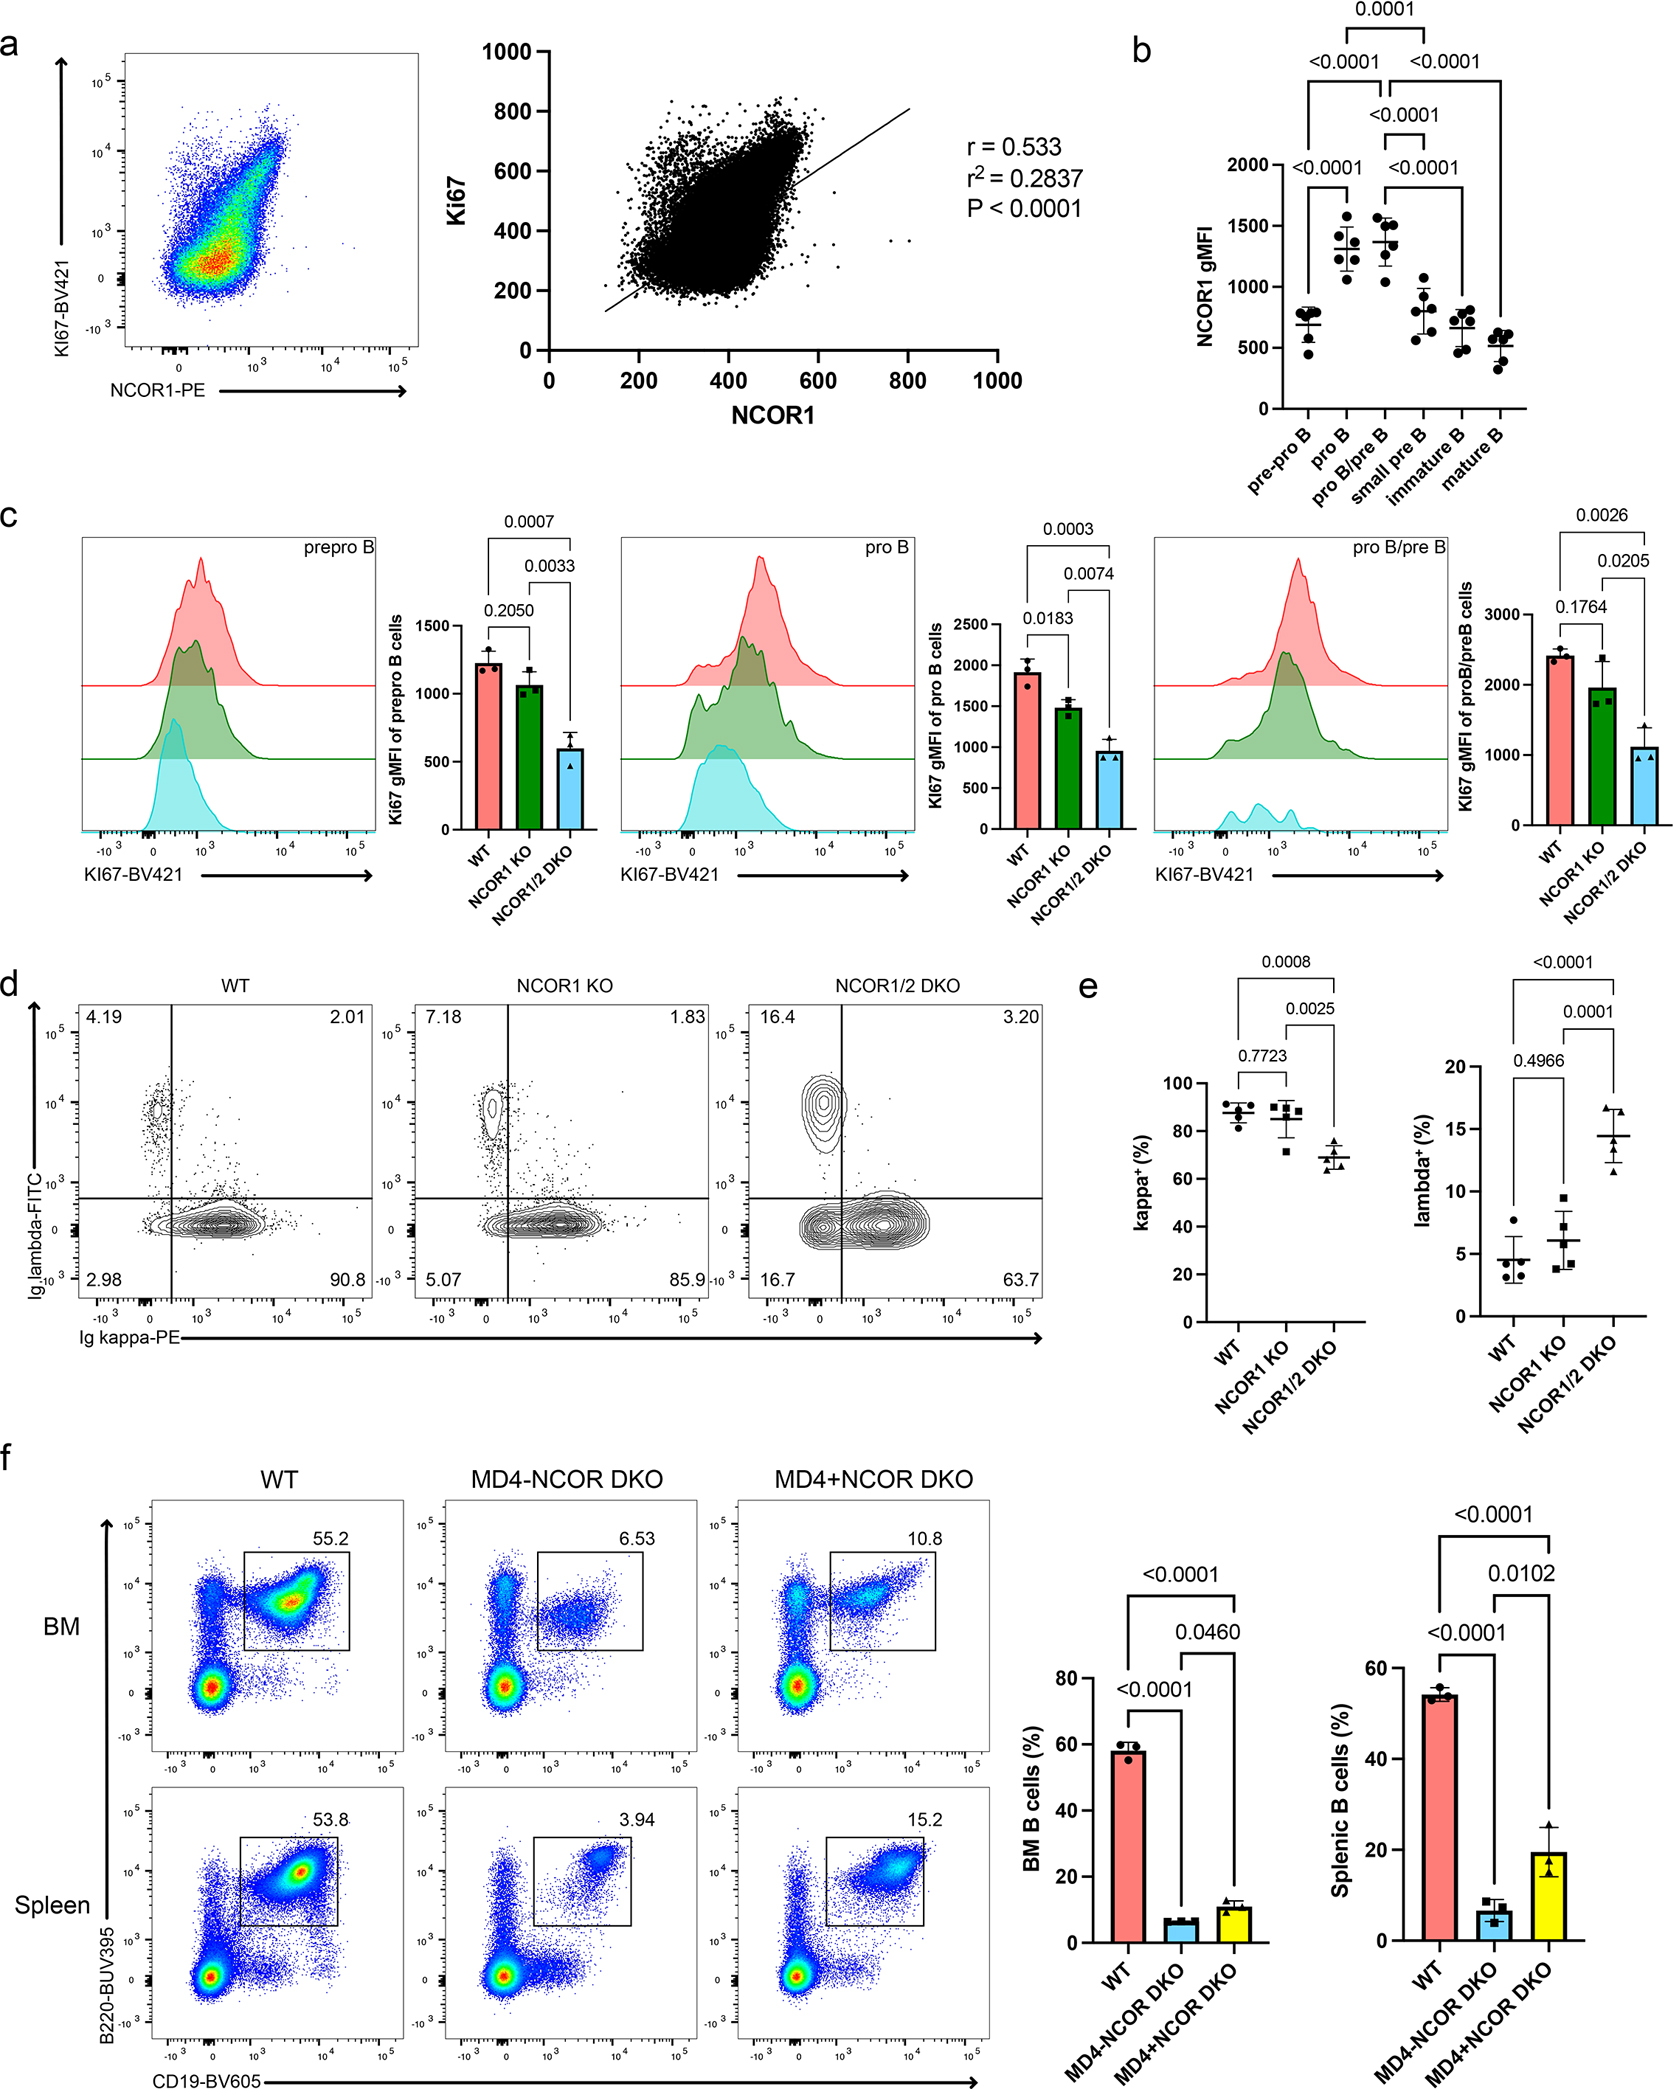
a. NCOR1 expression regulation in proliferating and non-proliferating cells. Representative flow cytometry plot of CD19+B220+ bone marrow B cells and the correlation between Ki67 and NCOR1 expression (left). Pearson correlation test (r and r2) between Ki67 and NCOR1 expression (right). Flow cytometry plot is representative of 6 mice from three independent experiments. b. NCOR1 gMFI expression in different B cell development stages. Datapoints were obtained from three independent experiments. c. Representative Ki67 expression differences between WT, NCOR1 KO, and NCOR1/2 DKO B cells in pre-pro-B, pro-B and pro-B/pre-B cells. Cells were pre-gated on B220+CD43+ B cells, which comprise the majority of proliferating progenitor B cells. Corresponding Ki67 gMFI is plotted on the right. Flow cytometry plot represents n=3 for each genotype derived from two independent experiments. d.e. Representative flow cytometry plots of the kappa:lambda ratio of splenic CD19+B220+ B cells (d) and frequency of Ig κ and Ig λ between WT, NCOR1 KO and NCOR1/2 DKO (e). Data represent n=5 mice for each genotype from three independent experiments. f. Bypassing recombination defects via MD4 BCR-transgene expression. CD19+B220+ B cell frequency in the bone marrow and spleen represent n=3 for each genotype from three independent experiments. An ordinary one-way ANOVA with Tukey’s multiple comparison was performed for statistical analysis; error bar represents standard deviation. All measure of centers indicate mean.