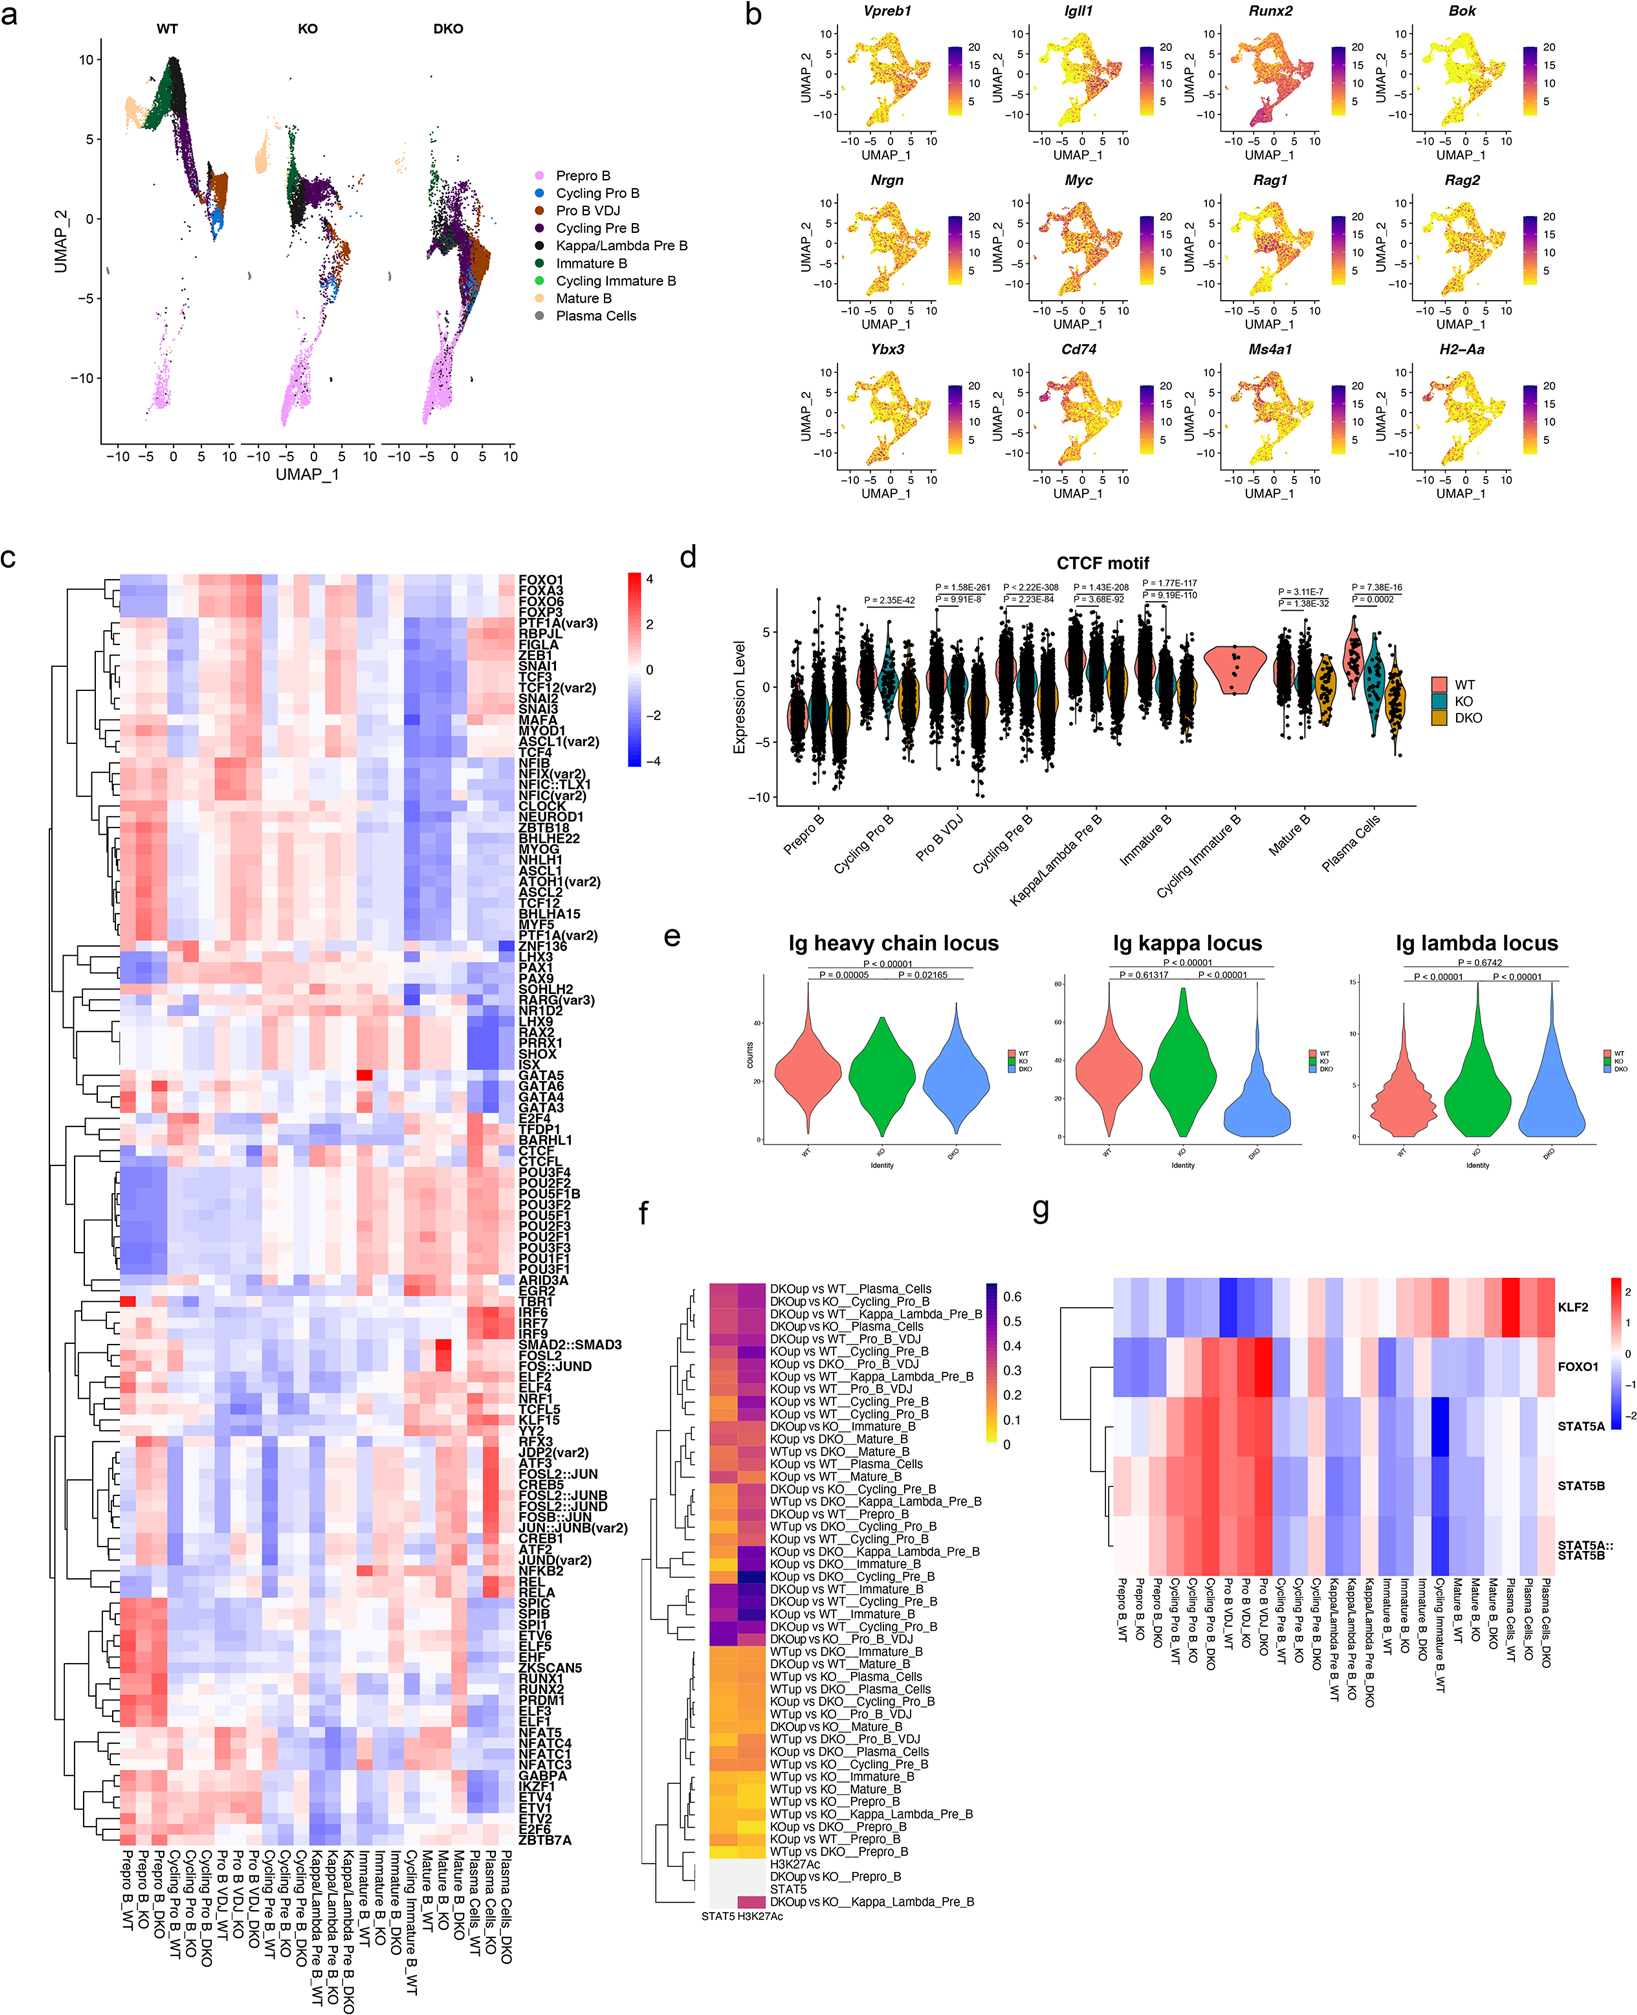
Figure 4. Single-cell ATAC-seq reveals the epigenetic landscape regulated by nuclear corepressors.

a. scATAC-seq feature plot split by genotype. b. Accessibility of stage-defining genes shown as a feature plot. c. Heatmap of transcription factor motifs that are differentially present in the WT, NCOR1 KO and NCOR1/2 DKO cells in different clusters. Transcription factor motif analysis was performed using chromVar. Scale for the heatmap represents row z-scores. d. chromVar motif score for CTCF in different clusters split by the different genotypes. A two-tailed Wilcoxon rank sum test was used to compute the p-value for pairwise comparisons with at least a log2 fold change of 0.25. Data represents WT (n=8852 cells), NCOR1 KO (n=6008 cells) and DKO (n=8574 cells) from a single biologically replicate derived from three separate captures. e. Accessibility of the immunoglobulin heavy chain locus in pro-B VDJ cluster, and κ and λ chain locus accessibility in the Kappa/Lambda Pre-B cell cluster amongst wildtype, NCOR1 KO and NCOR1/2 DKO cells. A one-way ANOVA was performed to compute the statistical significance in differences. f. Heatmap denoting the fraction of overlap between differentially accessible regions and H3K27Ac and STAT5 sites. H3K27Ac and STAT5 ChIP-seq data were obtained from GSM463433 and GSM2309799, respectively. Heatmap was clustered on rows. Color scale represents the fraction of overlap. g. Heatmap of chromvar motif score for KLF2, FOXO1 and STAT5 motifs in different clusters. Color scale represents row z-score.
