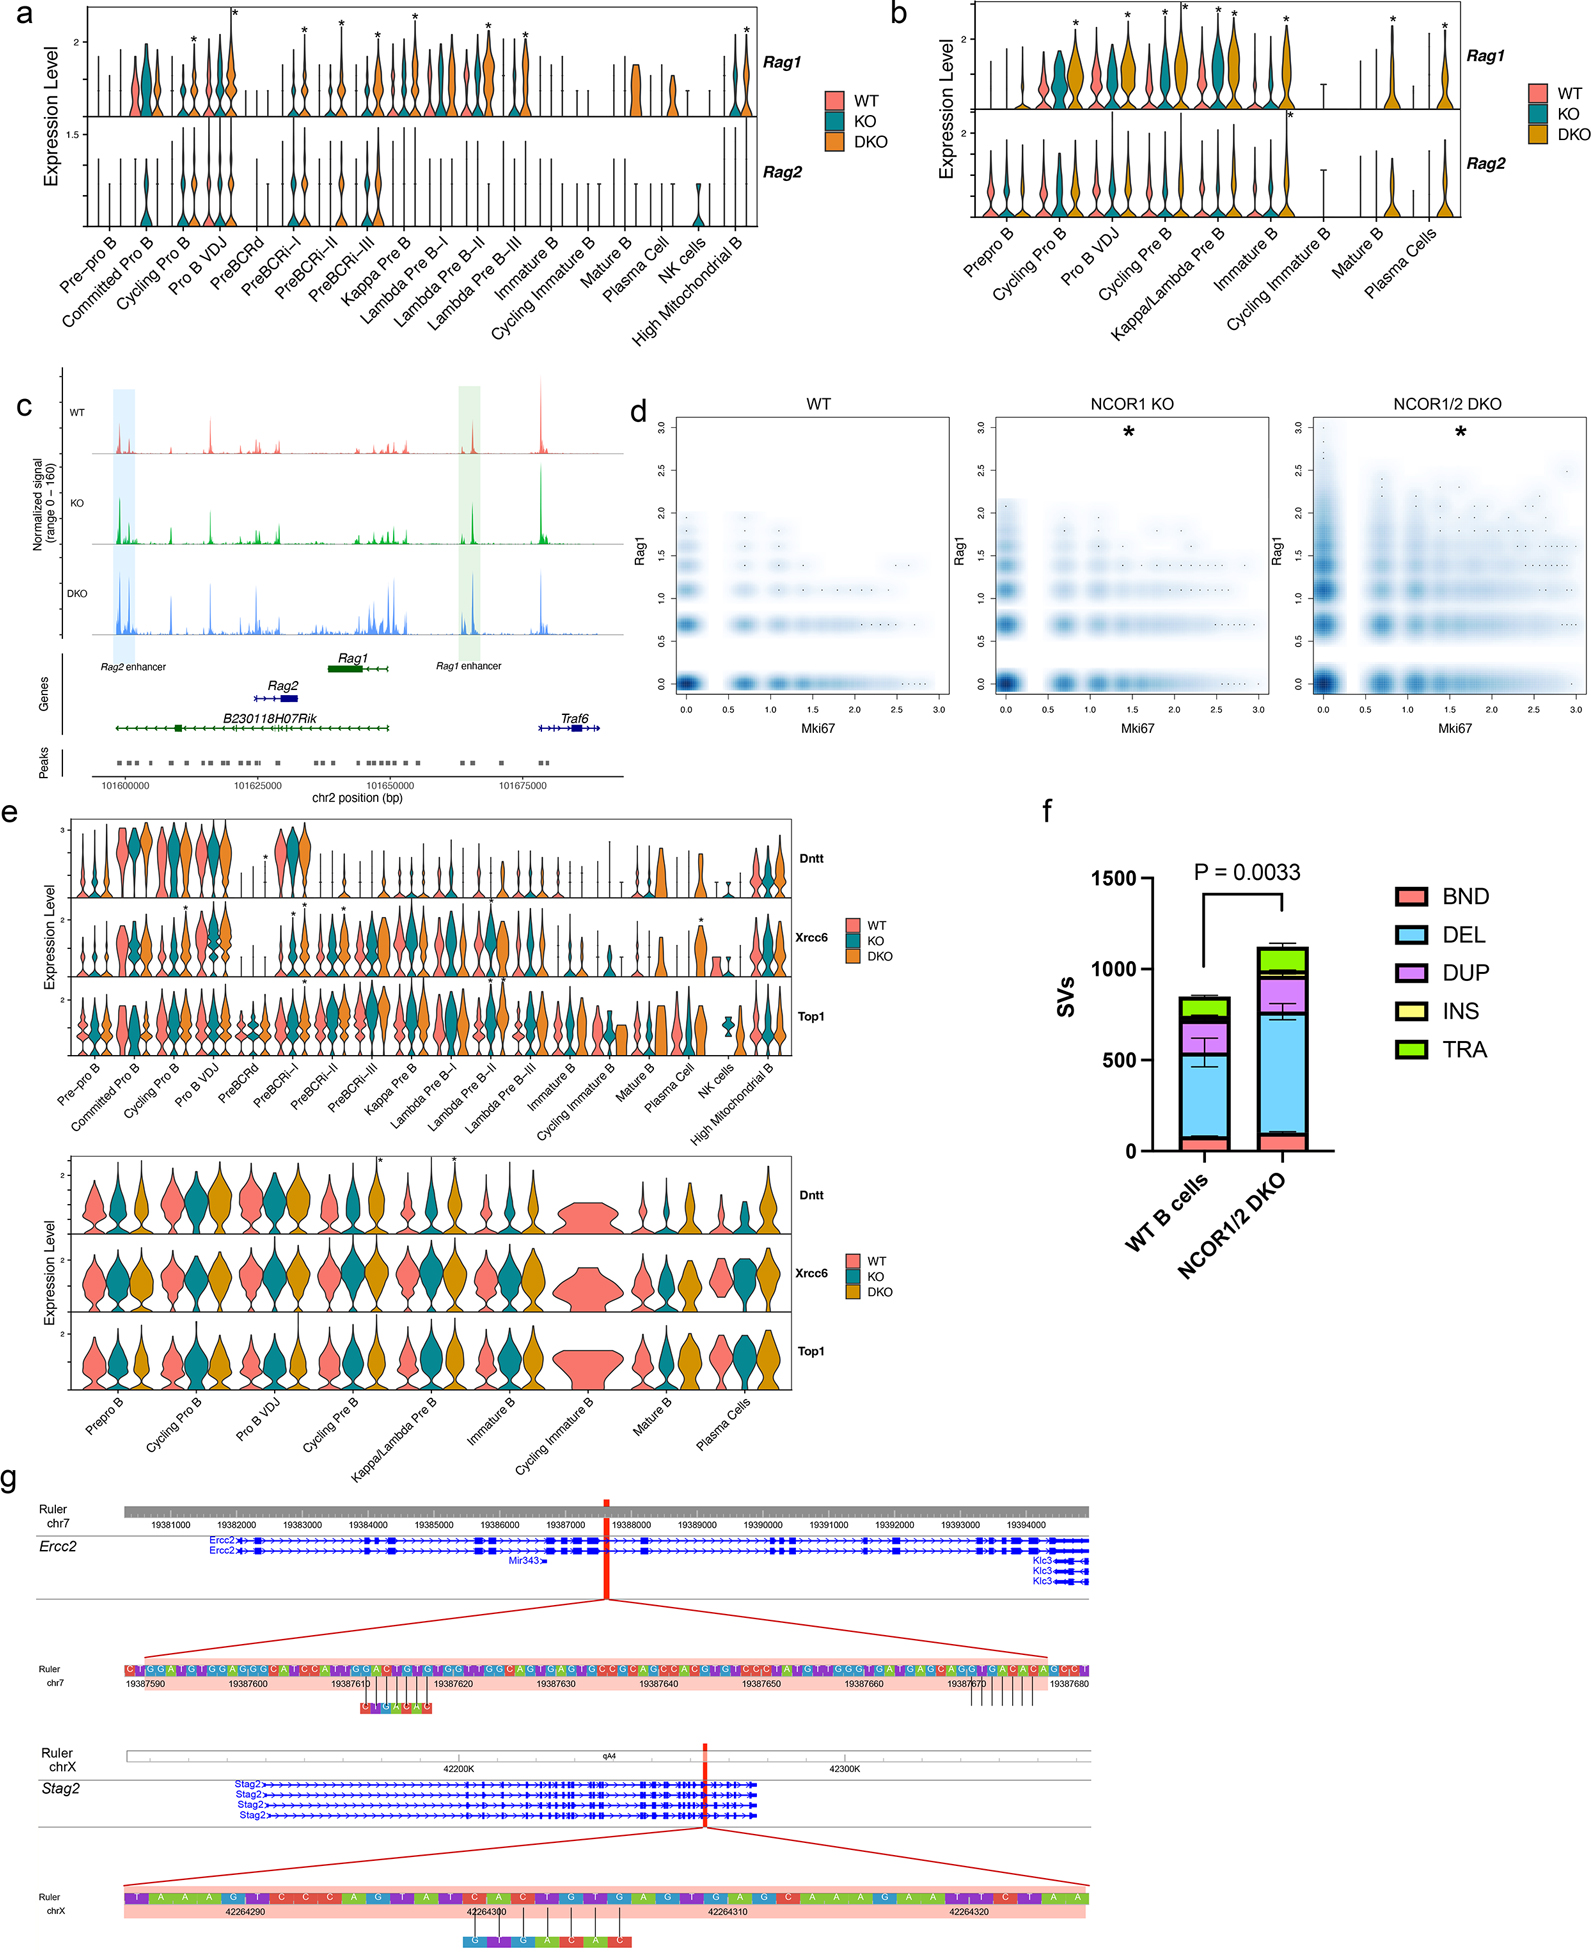
Figure 5. Nuclear corepressors segregate RAG expression from proliferating cells and protect the genome integrity.

a. Rag1 and Rag2 RNA expression differences between WT, NCOR1 KO and NCOR1/2 DKO B cells derived from scRNA-seq. b. Rag1 and Rag2 scATAC-seq accessibility differences between WT, NCOR1 KO and NCOR1/2 DKO B cells across different clusters. c. Rag1 and Rag2 track locus of immature B cells and accessibility profiles split by genotype. The blue highlighted area indicates the Rag2 enhancer, whereas the green highlighted area indicates the Rag1 enhancer. The y-axis is identical for all three plots (range from 0–160). d. Density scatter plot of Mki67 and Rag1 transcript between WT, NCOR1 KO, and NCOR1/2 DKO B cells. Asterisk (*) indicates statistical significance with FDR <0.05 with at least a log2 fold change > 0.58 when compared to the frequency of wildtype B cells. A permutation test was performed to calculate the statistical significance of frequency changes of Mki67+Rag1+ cells in the NCOR1 KO and NCOR1/2 DKO compared to the wildtype cells. The package scProportiontest was used to perform the statistical test. e. Recombination-related (Dntt, Xrcc6 and Top1) gene expression and accessibility differences in different clusters. f. Number of structural variants in wildtype (n=2) and NCOR1/2 DKO (n=3) B220+CD19+ B cells. BND; breakend, DEL; deletion, DUP; duplication, INS; insertion, TRA; translocation. Structural variants were called using Smoove. A two-tailed t-test was performed to compute the statistical significance. g. Cryptic heptamer recombination sequences found in deleted regions of Ercc2 and Stag2 genes from NCOR DKO B cells.
