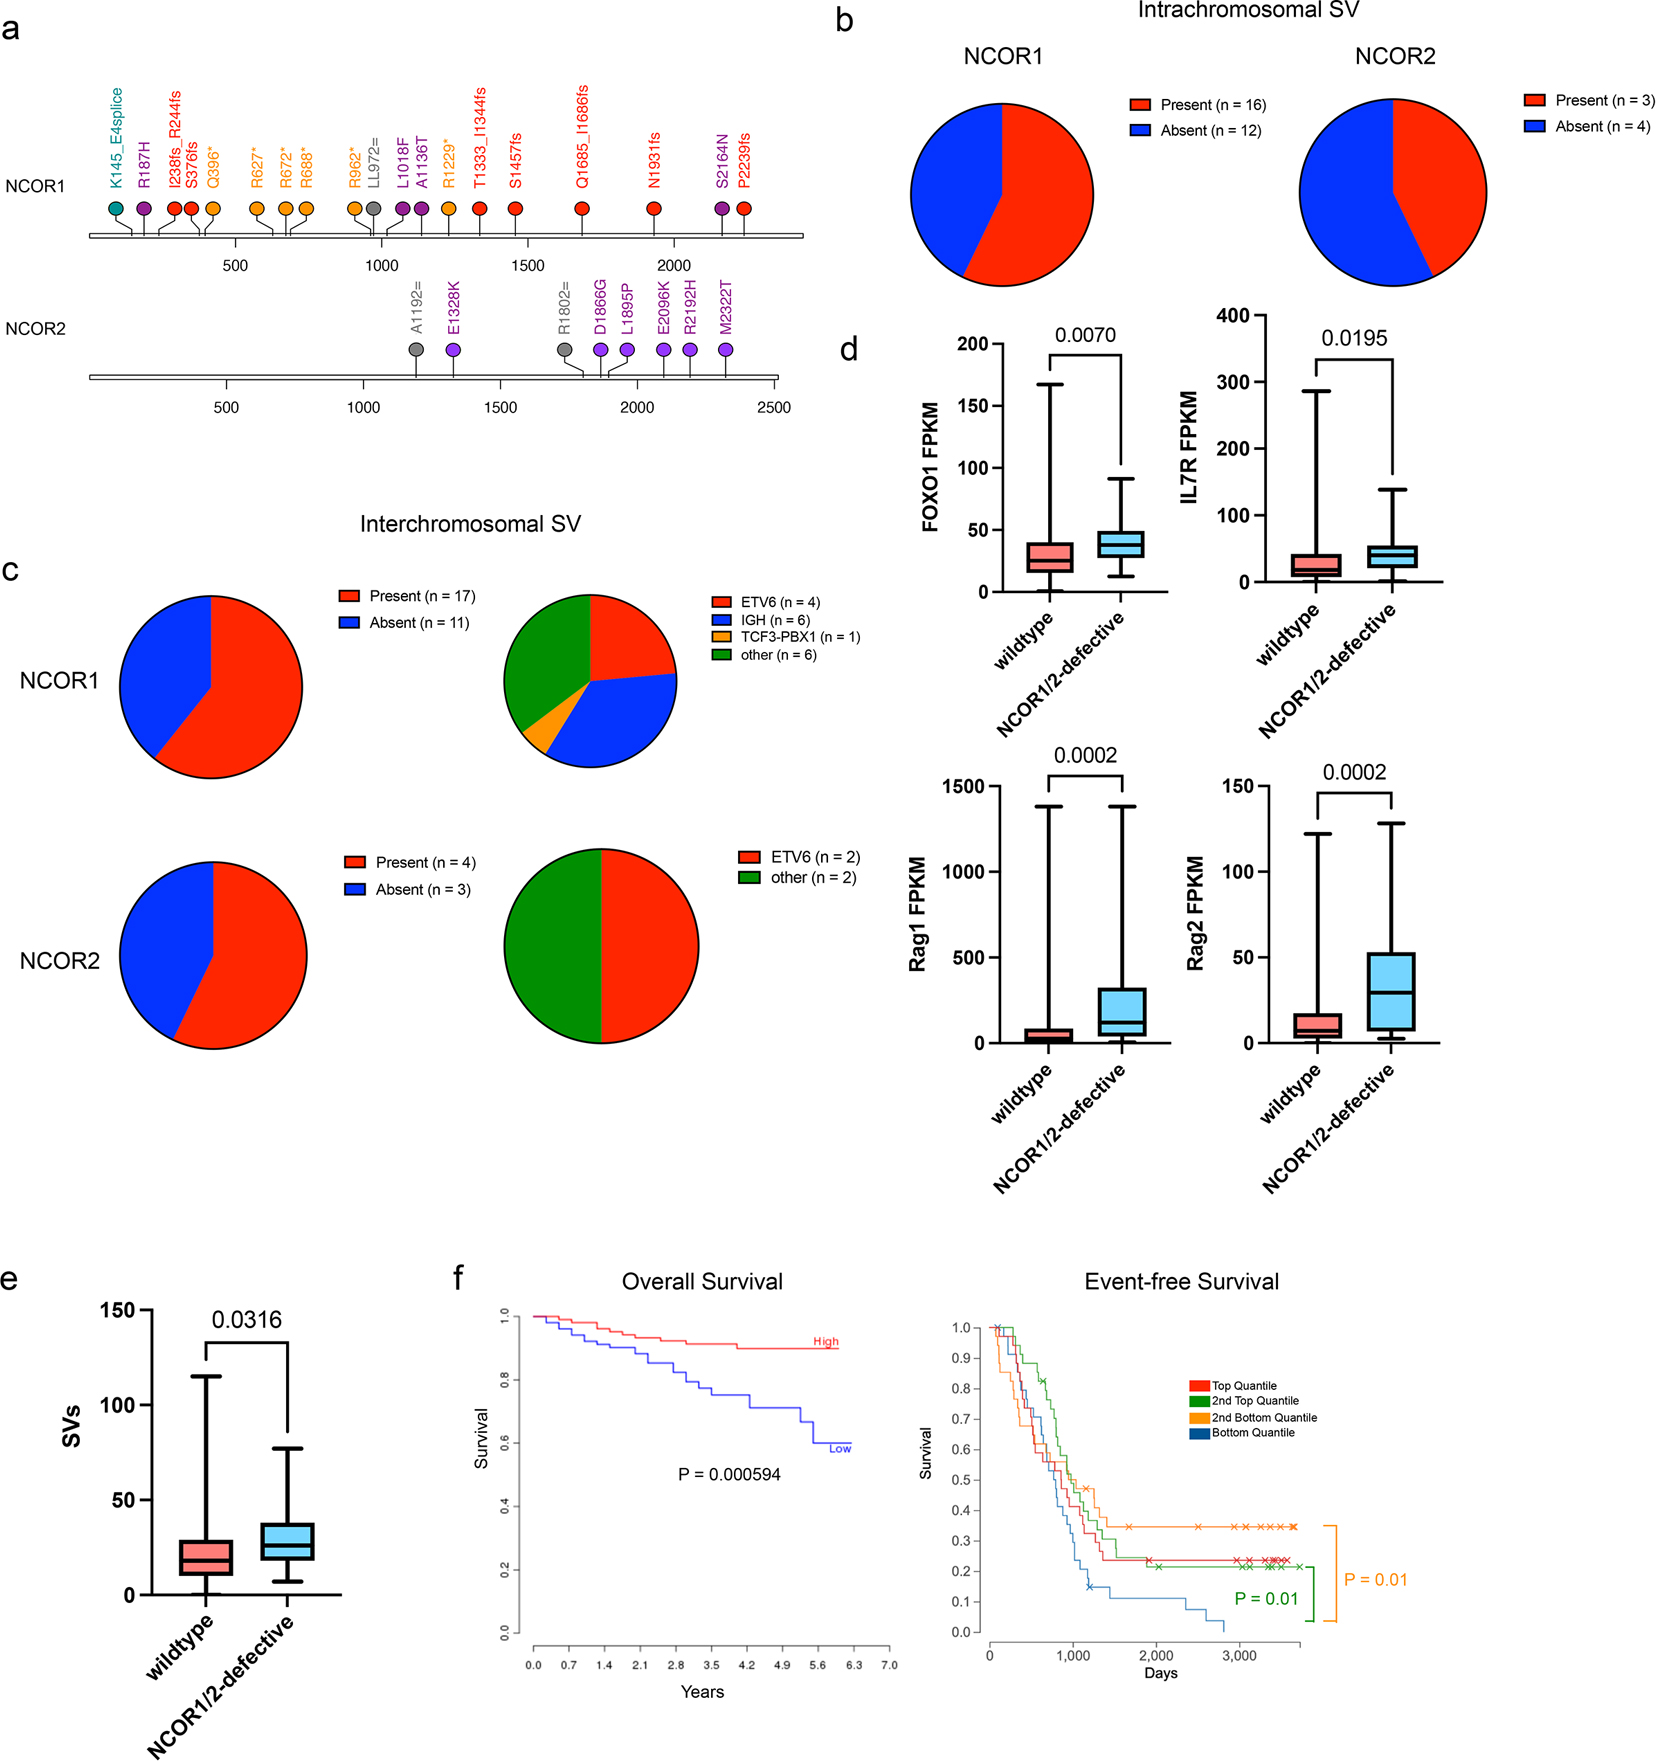
Figure 7. Human B-ALL patients with nuclear corepressor mutations harbor structural variants with high RAG expression.

a. Lollipop plot of NCOR1 and NCOR2 mutations found in human B-ALL patients. Orange/*; nonsense mutations; Red/fs, frameshift mutation; green/=; silent mutations; purple, missense mutations. b. Presence of intrachromosomal structural variants in B-ALL patients with NCOR1 mutations (left) or NCOR2 mutations (right). c. Presence of interchromosomal structural variants in B-ALL patients with NCOR1 mutations (top left) or NCOR2 mutations (bottom left). Breakdown of chromosome translocation types in those that had interchromosomal structural variants with NCOR1 mutations (top right) or NCOR2 mutations (bottom right). d. FOXO1, IL7R, RAG1 and RAG2 expression in NCOR1/NCOR2 wildtype (n=709) NCOR1 or NCOR2-defective B-ALLs (n=2). P-value was derived from a two-tailed unpaired t-test. e. Number of structural variants in NCOR1/NCOR2 wildtype B-ALLs (n=539) and NCOR1 or NCOR2-defective human B-ALLs (n=15). P-value was derived from a one-tailed unpaired t-test. f. NCOR1 expression correlation with B-ALL prognosis of overall survival (left; years) and event-free survival (right; days). Low and high correspond to below-median and above-median expression, respectively (left) and p-value was generated using a log-rank test. For event-free survival, blue indicates bottom quantile, orange is 2nd bottom quantile, green is 2nd top quantile, and red is top quantile (right) with p-values generated using a log-rank test. Mutation profile, presence of structural variants, and RAG1/RAG2 expression from Human B-ALL data was obtained from St Jude ProteinPaint. The correlation of NCOR1 expression with overall survival was derived from PRECOG, and quantile NCOR1 expression correlation with event-free survival was obtained from St Jude ProteinPaint. Box plot center line represents median, with the box extending from 25th to 75th percentile. The whiskers represent the minimum and maximum value.
