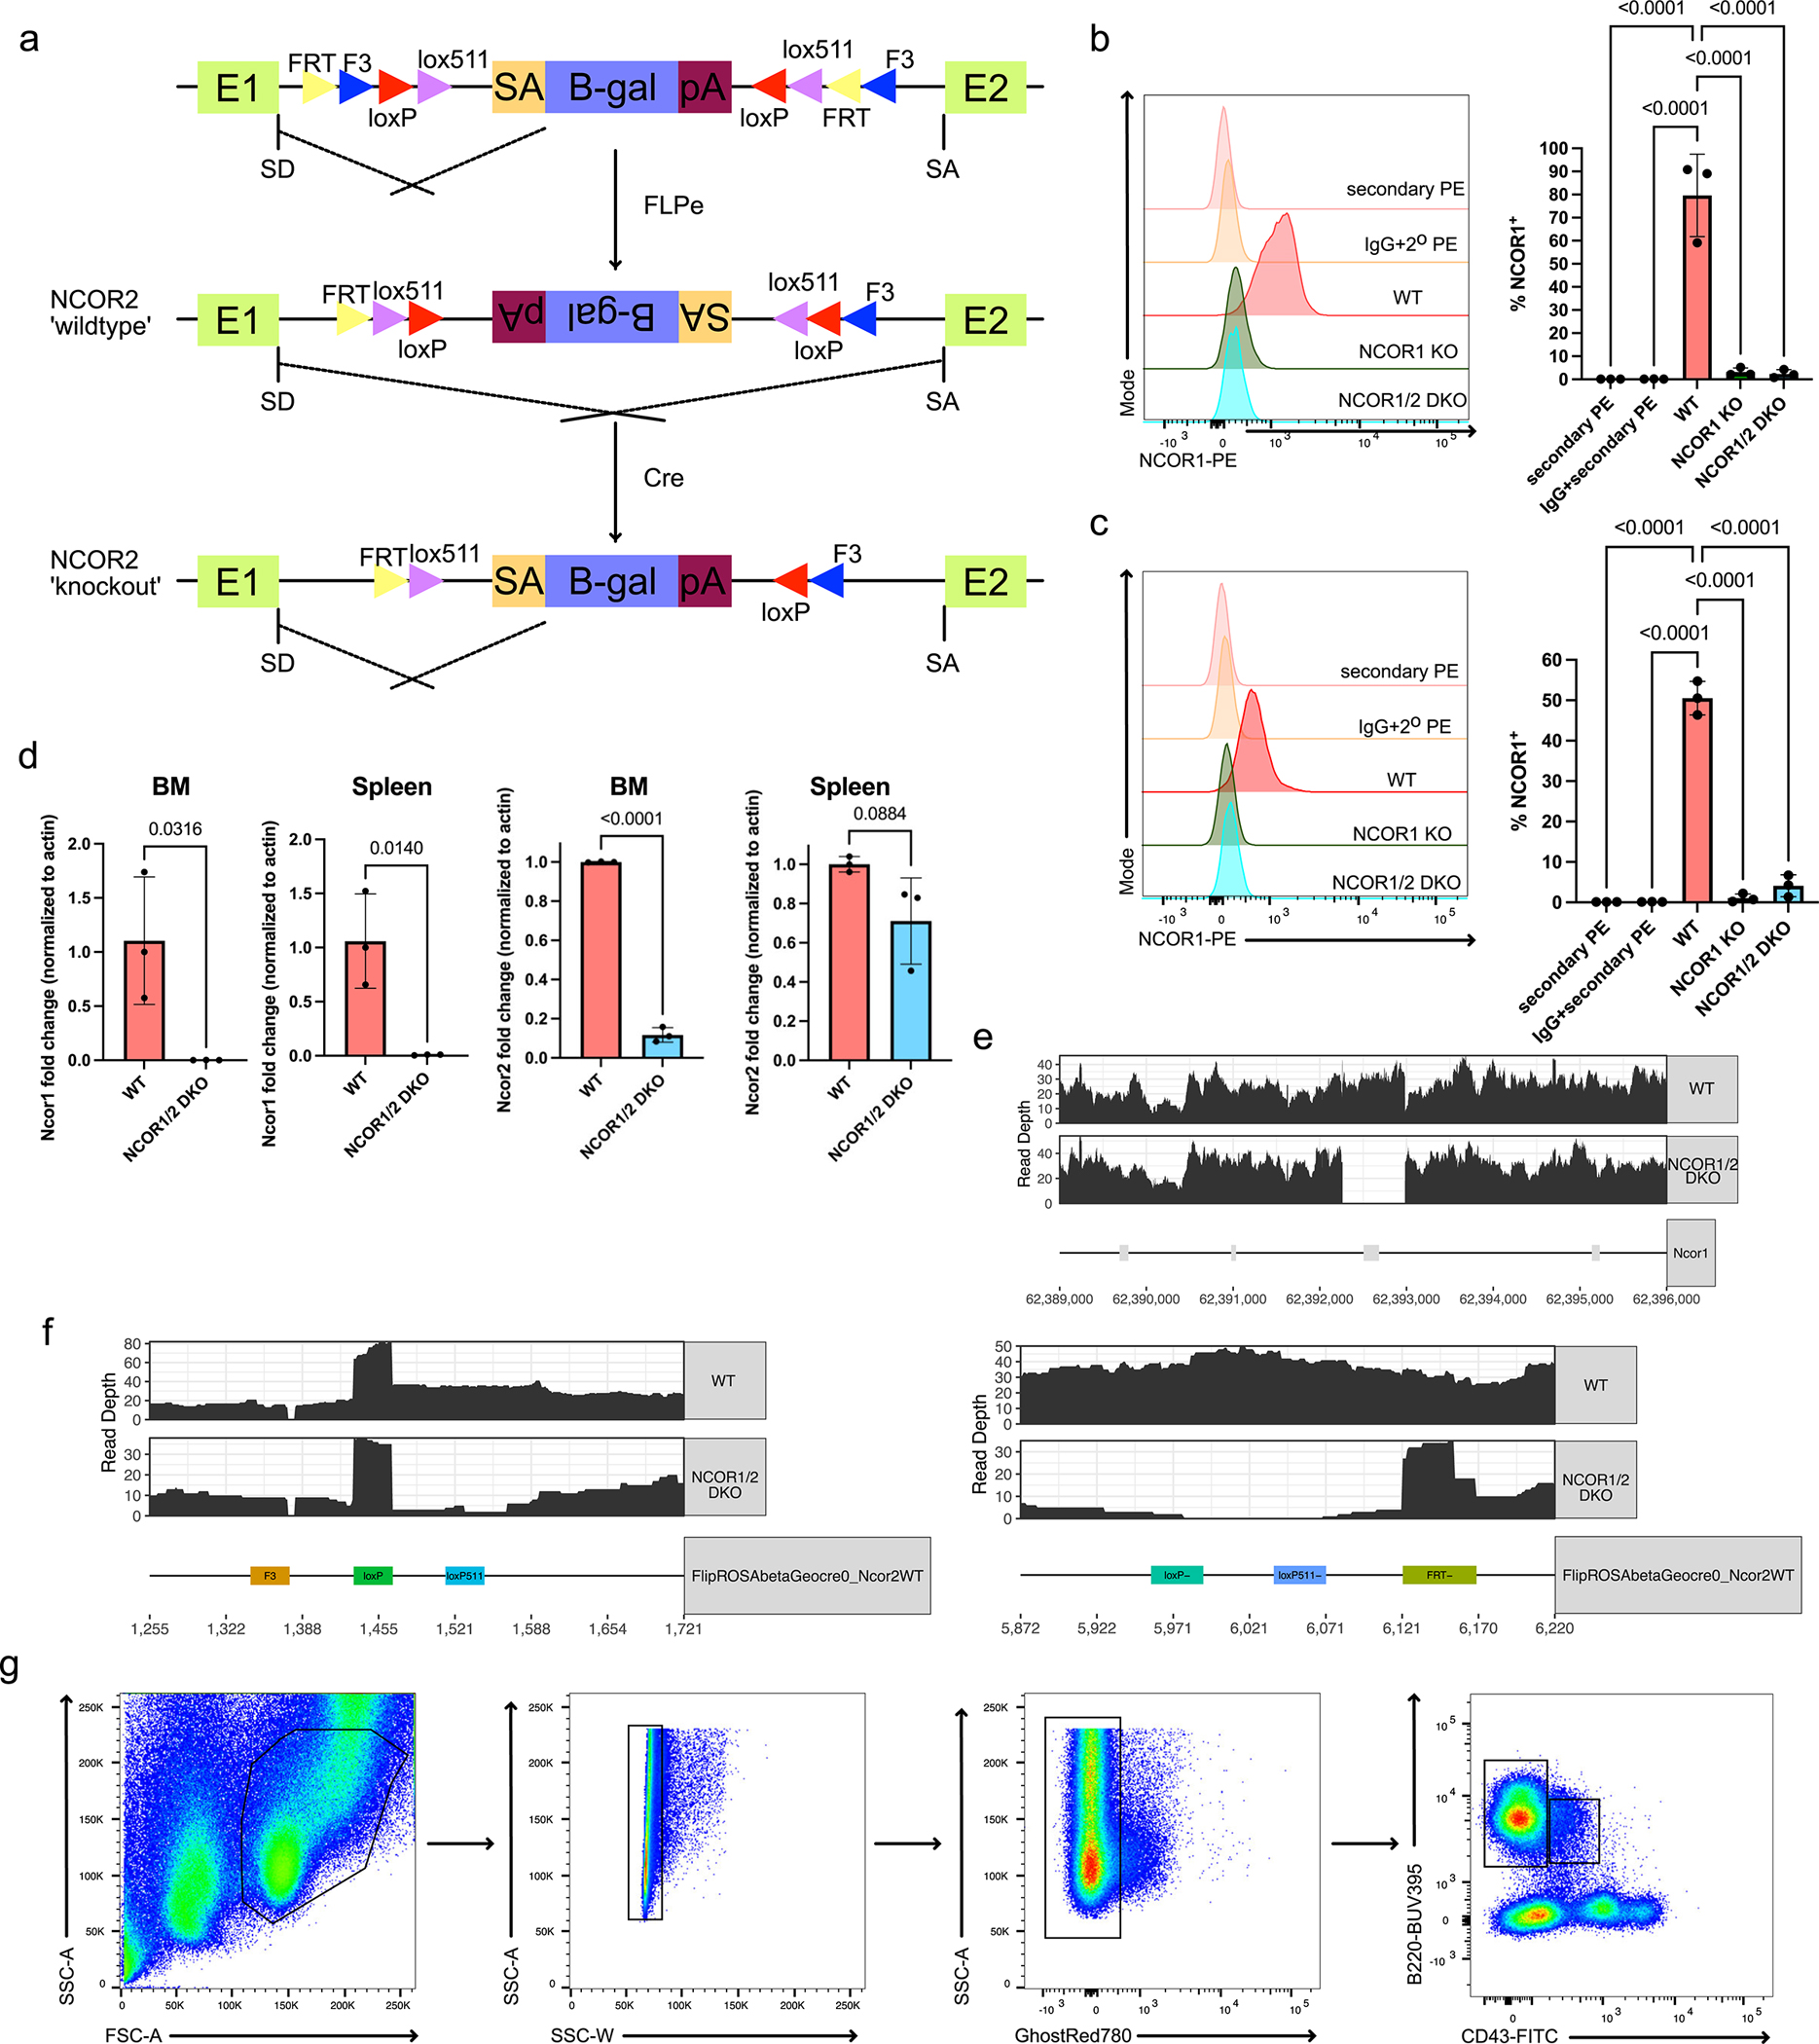
Extended Data Fig. 1. Ncor2 conditional knockout mouse model and flow cytometry gating scheme.

a. Schematic for generating Ncor2 flox mice using the flip-excision system (FlEx). A retrovirus vector containing a strong splice acceptor site followed by a lacZ reporter gene was flanked by FRT and loxP sites. This gene trap was targeted in the intronic region between exon 1 and 2. Mice harboring the gene trap were bred to FLPe constitutive expressing mice, inverting the gene trap and allowing for normal splicing of Ncor2. Subsequent breeding with Cd79a-Cre mice then allows for conditional deletion of Ncor2 in developing B cells. b. Representative NCOR1 protein expression in CD19+B220+ bone marrow B cells with isotype controls (left) and quantification of NCOR1-positive B cells (right). Each genotype represents n=3, from three independent experiments. Center of measure indicates mean and error bars indicate standard deviation. A one-way ANOVA was used to calculate statistical significance. c. Representative NCOR1 protein expression in CD19+B220+ splenic B cells with isotype controls (left) and quantification of NCOR1-positive B cells (right). Each genotype represents n=3, from three independent experiments. Center of measure indicates mean and error bars indicate standard deviation. A one-way ANOVA was used to calculate statistical significance. d. Quantification of Ncor1 and Ncor2 expression via qPCR in wildtype and NCOR1/2 double-knockout B cells from the bone marrow and the spleen. Each genotype represents n=3, from two independent experiments. Center of measure indicates mean and error bars indicate standard deviation. A two-tailed t-test was performed to calculate statistical significance. e. Whole-genome sequencing read depth coverage across the Ncor1 gene for wildtype and NCOR1/2 DKO B cells. f. Whole-genome sequencing mapping of reads across the Ncor2 gene trap for wildtype (Cre- littermate) and NCOR1/2 DKO B cells; left and right panels indicate 5’ and 3’ inversion breakpoints, respectively. g. Lymphocytes are gated using FSC-A, SSC-A, and then subsequently on SSC-A and SSC-W for singlets. Dead cells are excluded using the GhostRed780 Live/dead dye and gated on B220 and CD43. CD43+ and CD43− cells are gated on to assess Hardy fractions A-C and D-F, respectively.
