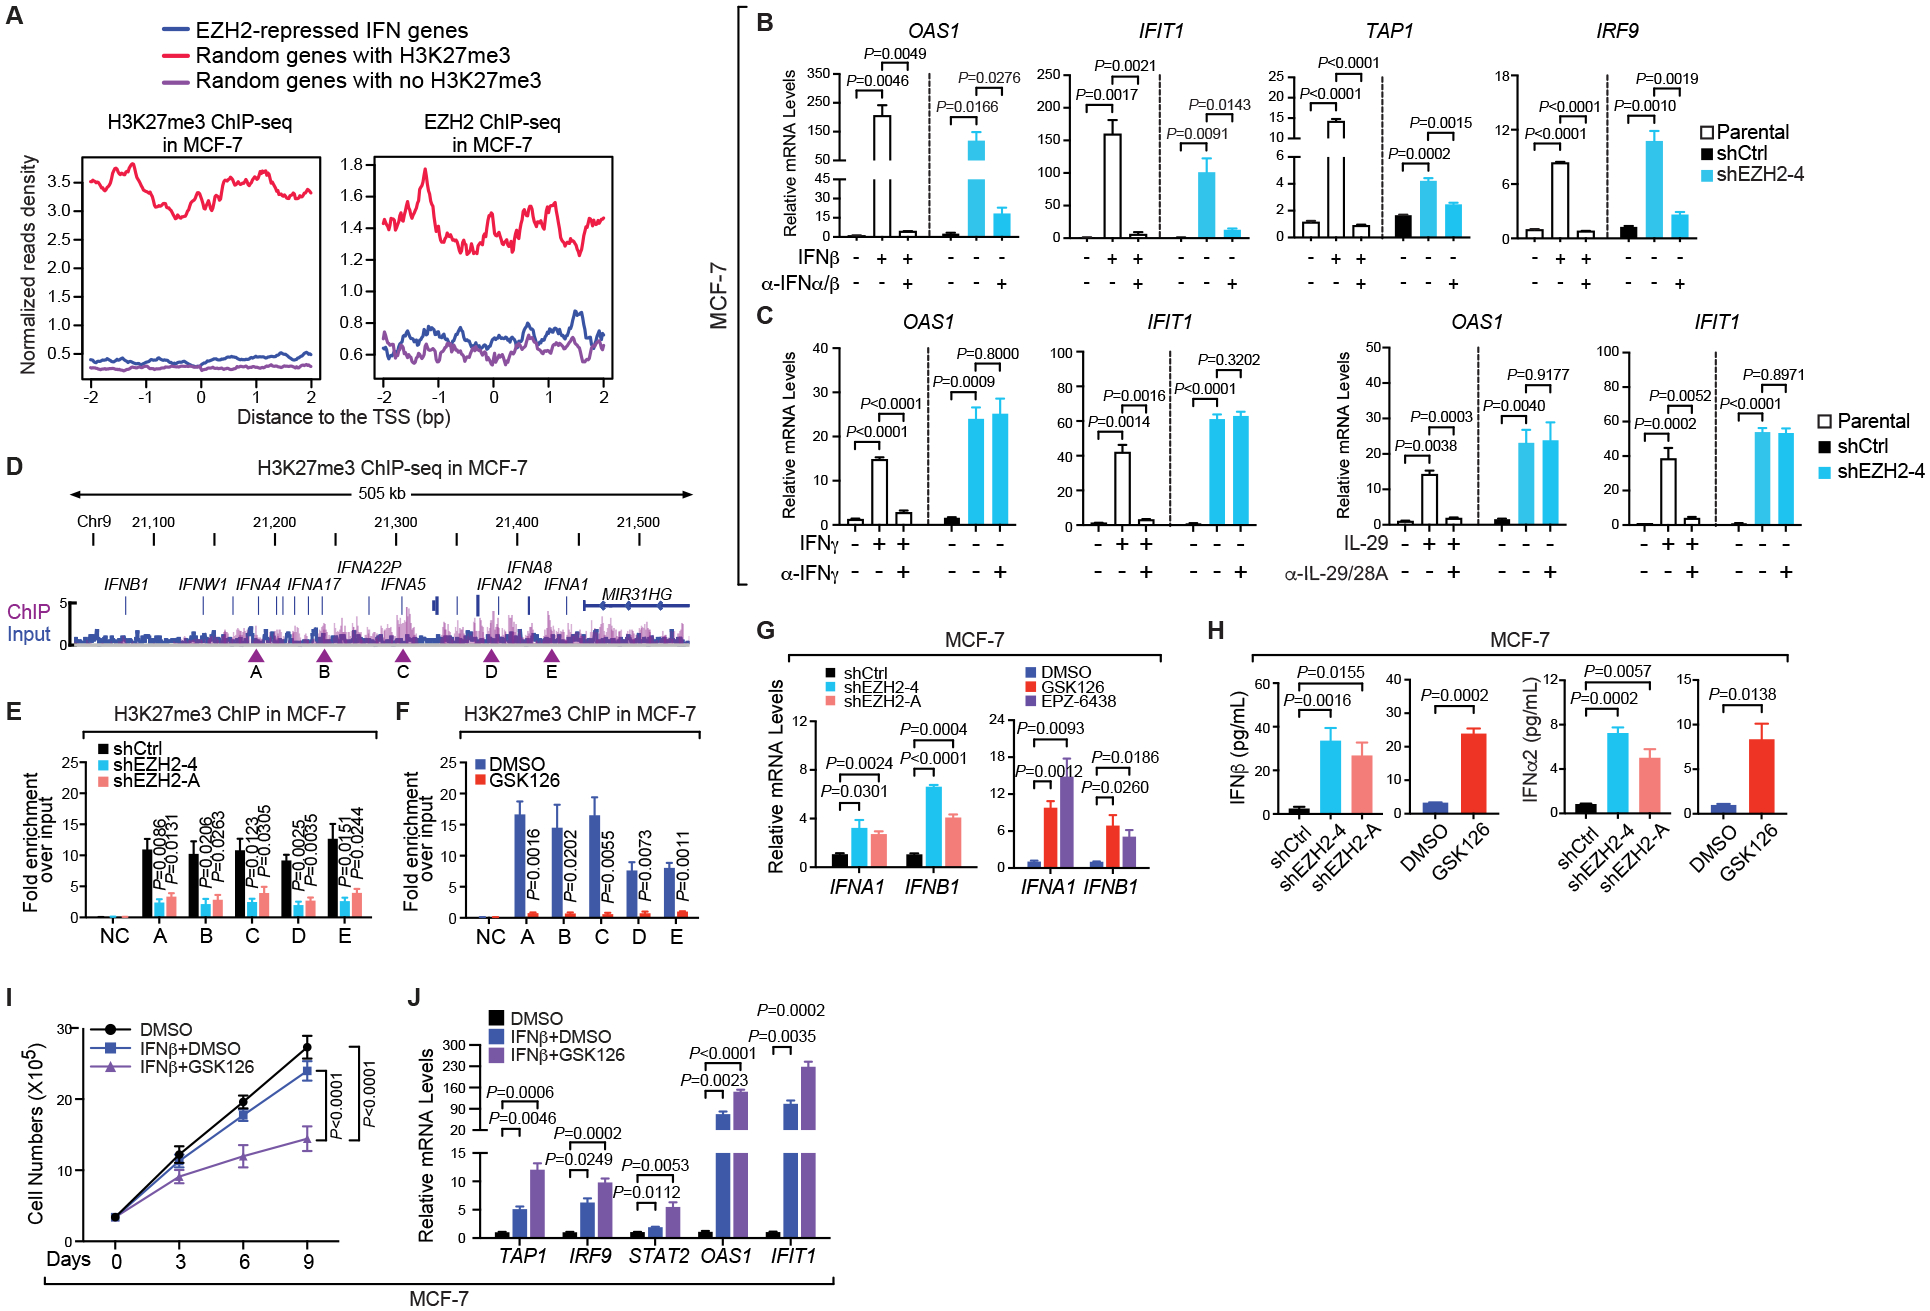
Figure 4. Type I interferon ligands are directly silenced by H3K27me3 in ERα+ breast cancer cells.

(A) Aggregation plots showing H3K27me3 (left panel) and EZH2 (right panel) ChIP-seq signals around the transcription start sites (TSS) of indicated groups of genes in MCF-7 cells. The same numbers of genes were randomly picked from genes bound by H3K27me3 (red line) or void of the histone modification (purple line), serving as positive and negative controls respectively. (B-C) Expression of specified genes in parental, control (shCtrl) or EZH2-knockdown (shEZH2–4) MCF-7 cells treated with (+) or without (–) the indicated IFN ligands for 7 days [250 pg/mL IFNβ in (B) and 250 pg/mL IFNγ or 50 ng/mL IL-29 in (C)] in the absence (–) and presence (+) of the corresponding neutralizing antibody for 24 hours [2.5 μg/mL α-IFNα/β in (B) and 2 μg/mL α-IFNγ or 4 μg/mL α-IL-29/28A in (C)]. (D) Snapshot of Integrative Genomics Viewer (IGV) showing the enrichment of H3K27me3 ChIP-seq signals at the type I IFN gene cluster in MCF-7 cells. Arrowheads, five chromatin sites selected for ChIP-qPCR confirmation. (E-F) ChIP of H3K27me3 in MCF-7 cells infected with control shRNA (shCtrl) or EZH2-specific shRNAs (shEZH2–4 and -A) (E) or treated with DMSO or 5 μM GSK126 for 7 days (F). NC, negative control using the promoter of KIAA0066. (G-H) Expression of IFNA1 and IFNB1 genes (G) and levels of IFNα2 and IFNβ proteins in the culture medium detected by ELISA (H) in MCF-7 cells where EZH2 was silenced by two independent shRNAs (shEZH2–4 and -A) or inhibited by 5 μM inhibitors [GSK126 and EPZ-6438 in (G) and GSK126 in (H)] for 7 days. (I-J) Growth (I) and expression of specified genes (J) in MCF-7 cells treated with DMSO or 200 pg/mL IFNβ, either alone or together with 3 μM GSK126, for up to 9 days.
