
Figure 3. T cell activation in MDS patients considered short-survivors and long-survivors treated with guadecitabine and atezolizumab.
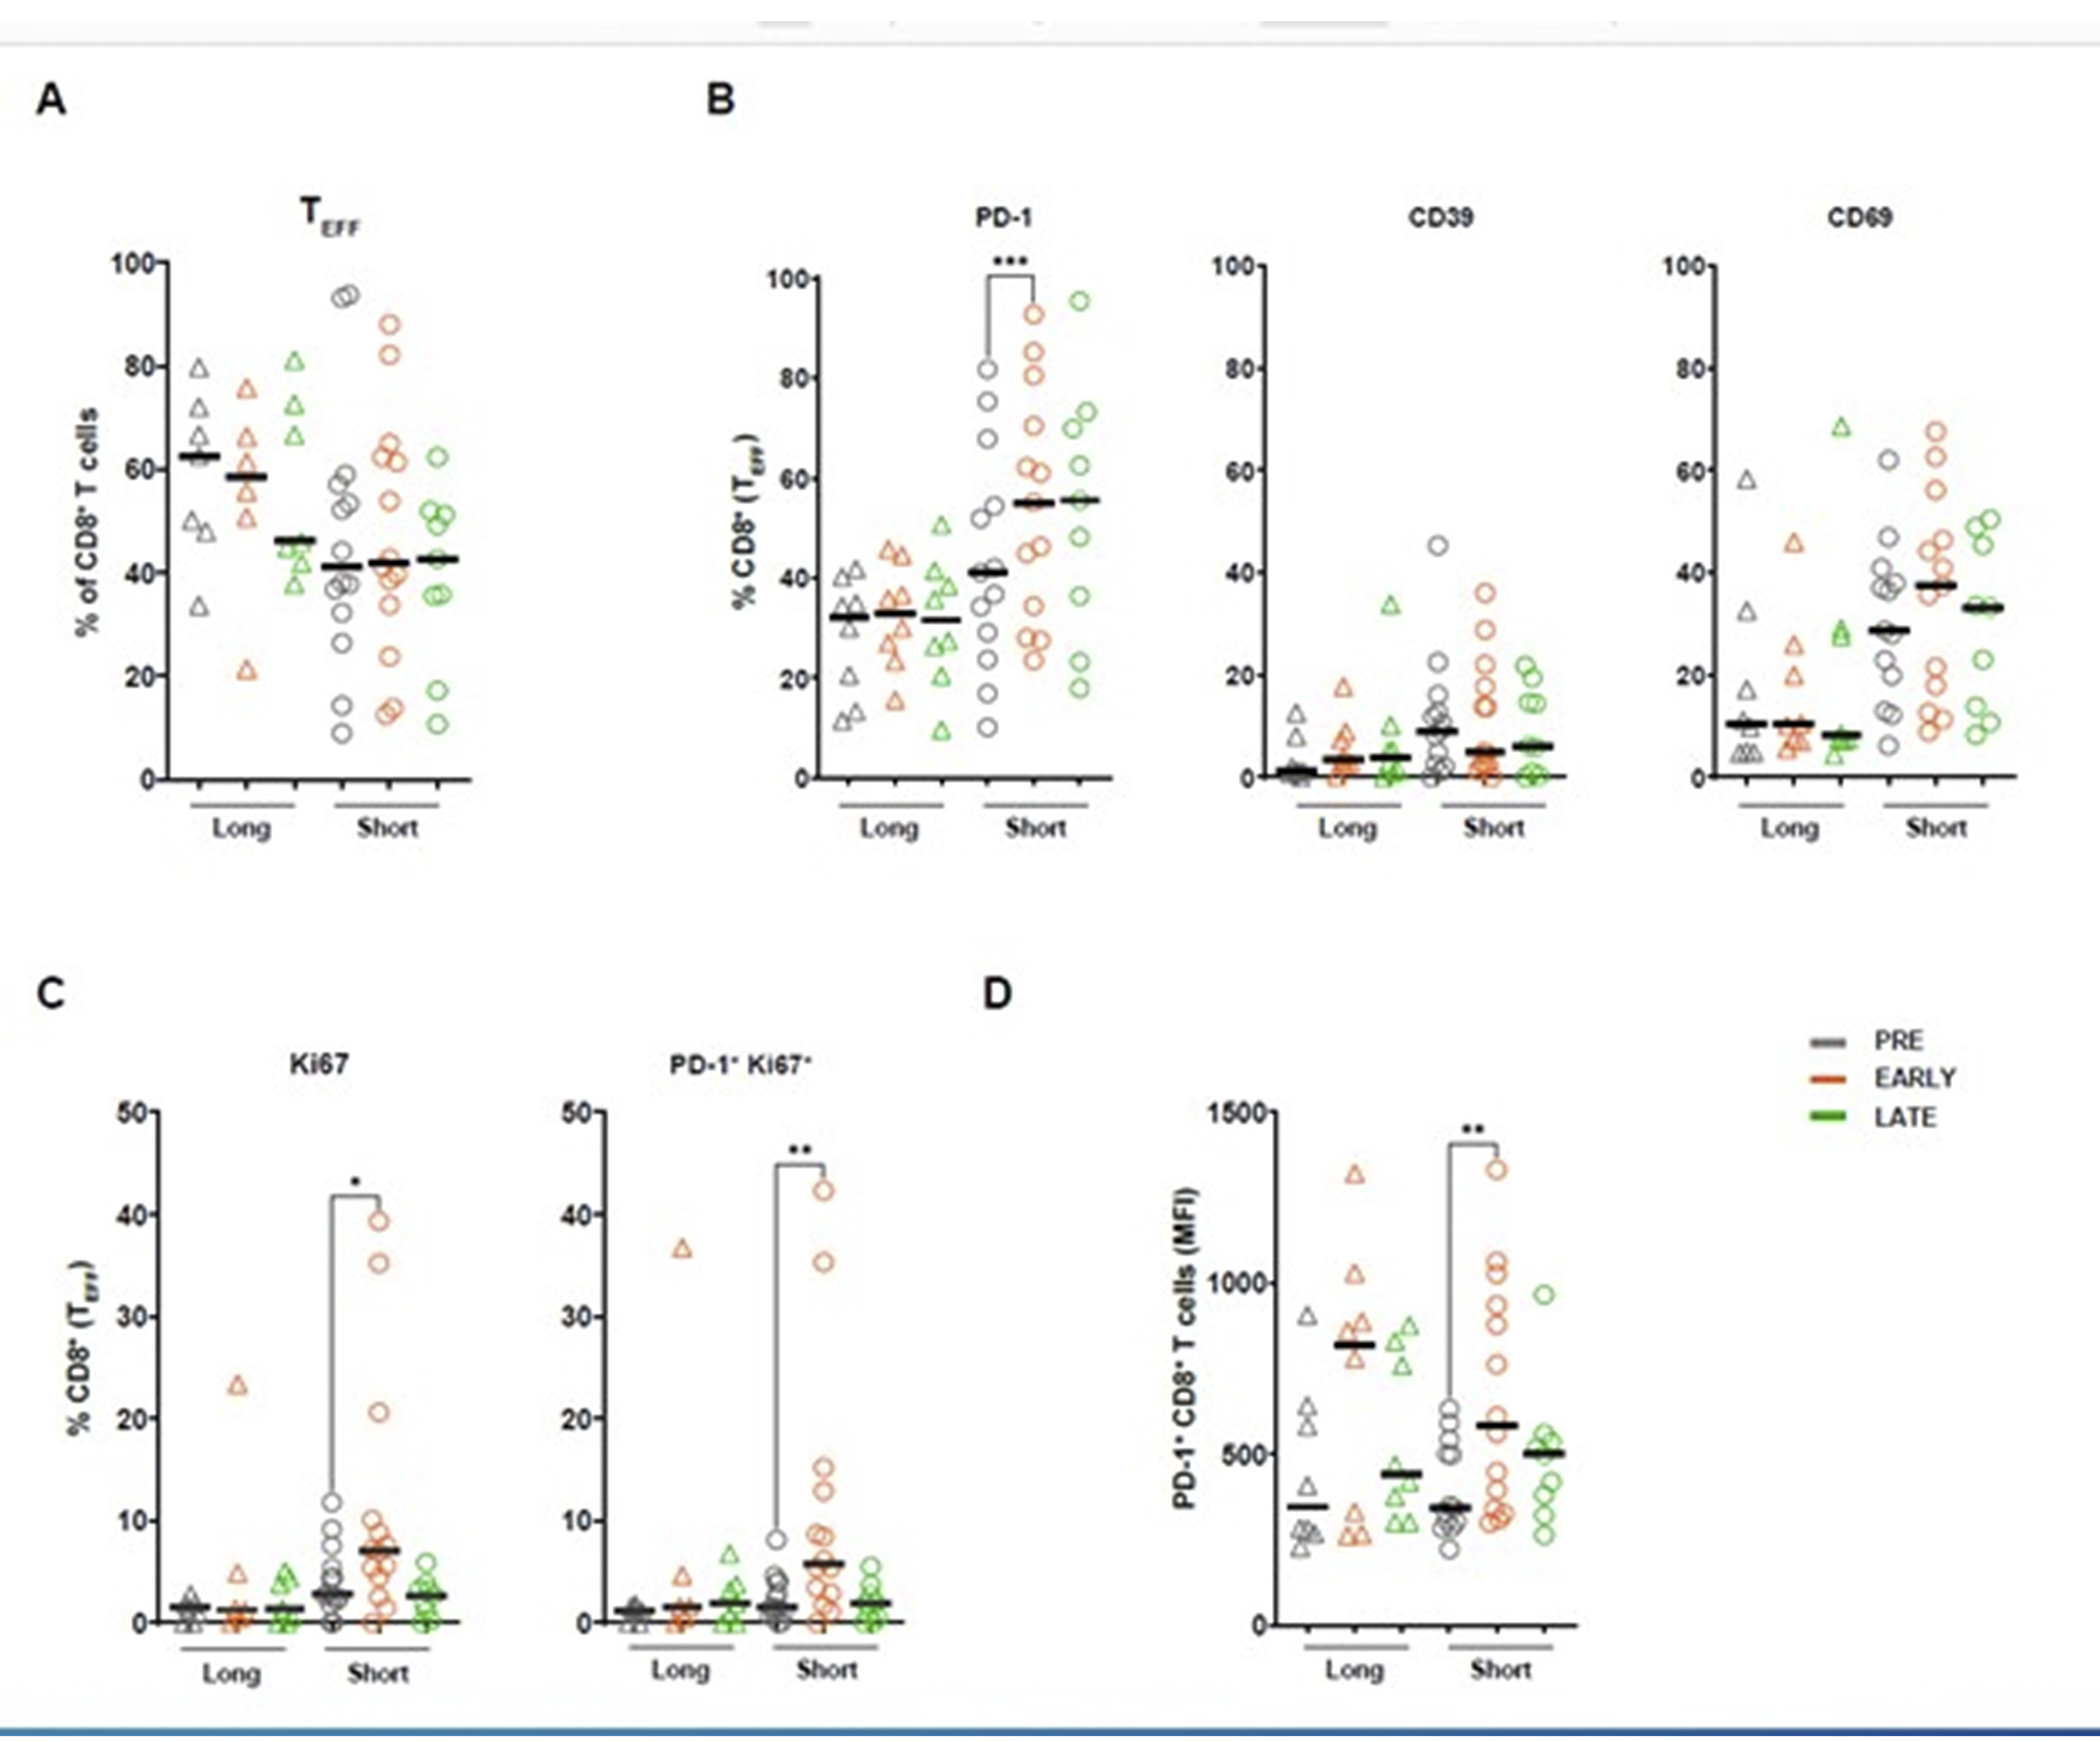
Comparative evaluation of T cell profiles in short- and long-survivors (>15 months) was performed using flow cytometry analysis on PBMCs from 21 patient samples at three different time points; Before treatment (PRE), after second treatment cycle (C2D1 or C2D8; EARLY), and after the third or fourth treatment cycle (C4D1, C4D8 or C5D1; LATE). Gating strategy of flow cytometry analysis is shown in Supplementary figure 1. A. CD8+ effector T cell (TEFF) subset in long- and short-survivors. B. Expression of cell surface activation markers PD-1, CD39, and CD69 on TEFF CD8+ T cells. Wilcoxon paired t test. Short-survivors, PD-1 p= 0.0002 (PRE vs EARLY) C. Proliferation of TEFF CD8+ T cells measured as intracellular secretion of Ki-67 alone or in combination with expression of PD-1 following the treatment in long-and short-survivors. Wilcoxon paired t test. Short-survivors; Ki-67 p= 0.004 (PRE vs EARLY), Ki-67 and PD-1 p=0.004 (PRE vs EARLY) D. Change in median fluorescence intensity (MFI) of PD-1 expression on overall CD8+ T cell population before and after the treatment. Wilcoxon paired t-test. Short-survivors p=0.005 (PRE vs EARLY).