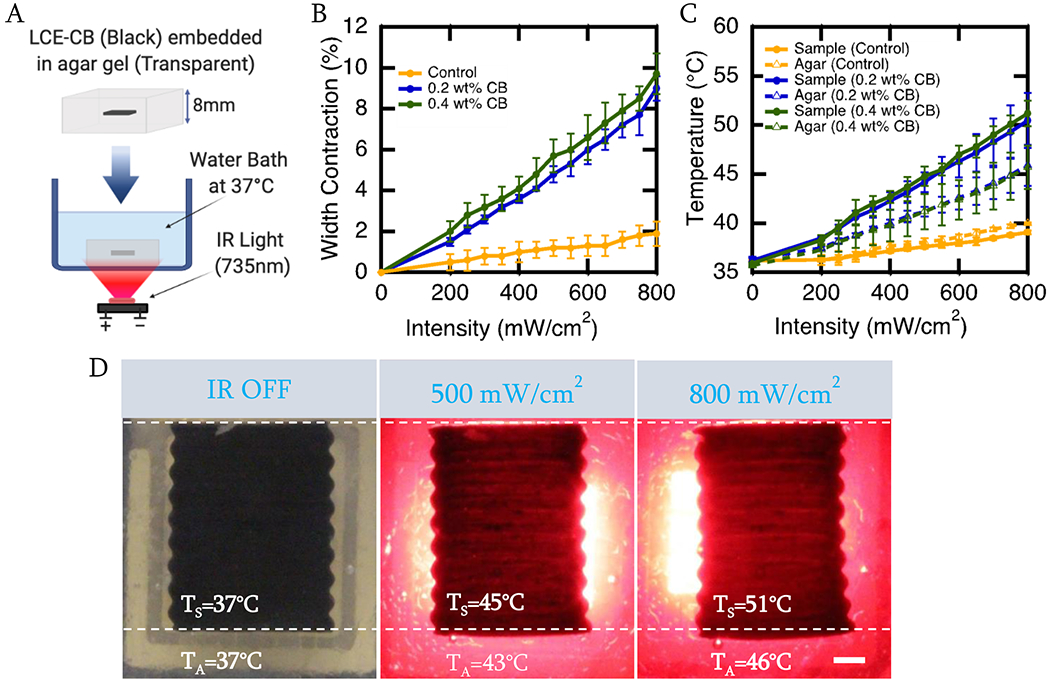
Figure 3.

Shape Change of LCE-CB sample with varying CB concentrations in response to varying IR light intensities. A) Schematic showing the setup used to analyze the shape change and temperature response of the LCE-CB sample in response to IR light. B) Photothermal actuation curve of neat LCE and LCE-CB sample with varying CB concentrations embedded in 0.5% agar in response to varying IR light intensities. C) Temperature measurement of neat LCE and LCE-CB samples with varying CB concentrations embedded in 0.5% agar in response to varying IR light intensities. Temperatures are measured at the sample surface and agar surrounding the sample (2mm vicinity) after 2 minutes of continuous IR light irradiation. D) Images showing contraction along the width and elongation along the length, as well as temperature of the sample (TS) and surrounding agar (TA) of an LCE-CB sample with 0.4 wt% CB embedded in 0.5% agar gel. LCE-CB sample at 0 seconds with IR off (left), sample actuation and temperature measured after irradiation with 500 mW/cm2 IR light for 120 seconds (middle), and sample actuation and temperature measured after irradiation with 800 mW/cm2 IR light for 120 seconds (right). Three samples are evaluated from three different batches for each composition (n=9 for each composition). Error bars represent standard deviation. Scale bar: 1mm.
