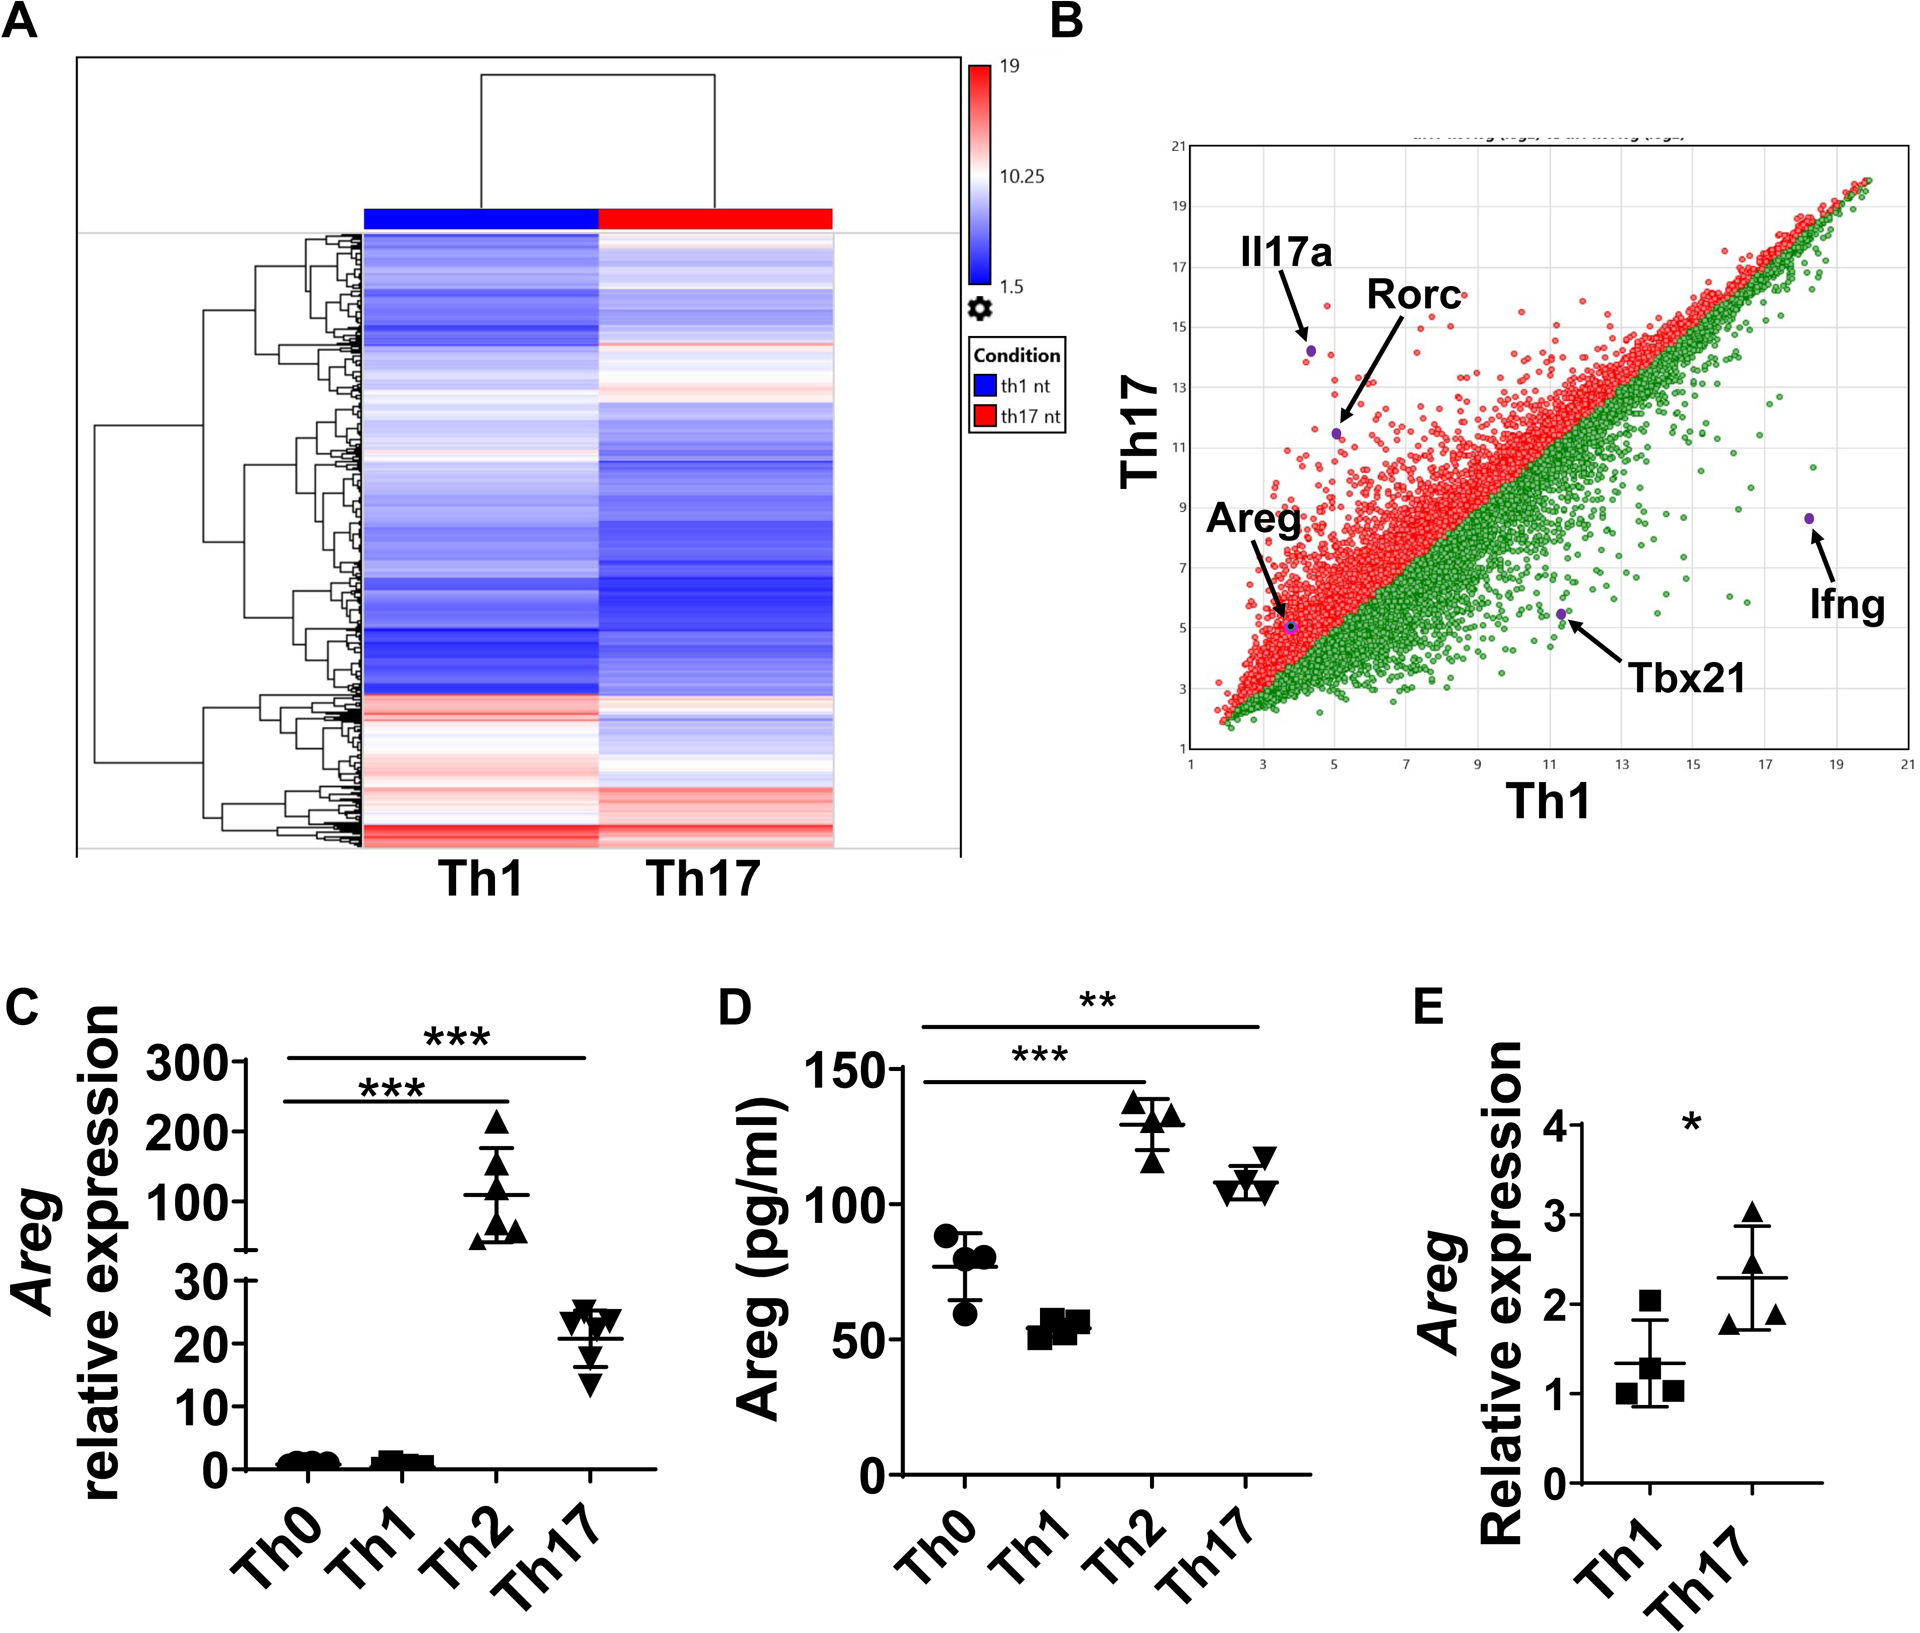
Figure 2. Th17 cells produce high levels of Areg.

(A-B) WT spleen CD4+T cells were activated with α-CD3 and α-CD28 mAb under Th1 and Th17-polarization conditions for 24h for analysis of gene differences by microarray analysis. (A) The expression of different genes is shown in the heatmap. (B) Scatterplot displaying the log2 fold change in expression between the two groups. (C-D) Splenic CD4+T cells of CBir1 Tg mice were cultured with irradiated APCs and CBir1 peptide under neutral, Th1, Th2, and Th17 polarization conditions for 5 days. Areg expression was detected by qRT-PCR (C). Areg production was determined by ELISA (D). (E) Intestinal Areg expression in CBir1 Tg Th1-recipient mice and Th17-recipient mice was determined by qRT-PCR. Representative data from 3 independent experiments. (C-D) One-way ANOVA; (E) unpaired Student’s t-test. *p < .05; **p < .01; ***p < .001; ****p < .0001.
