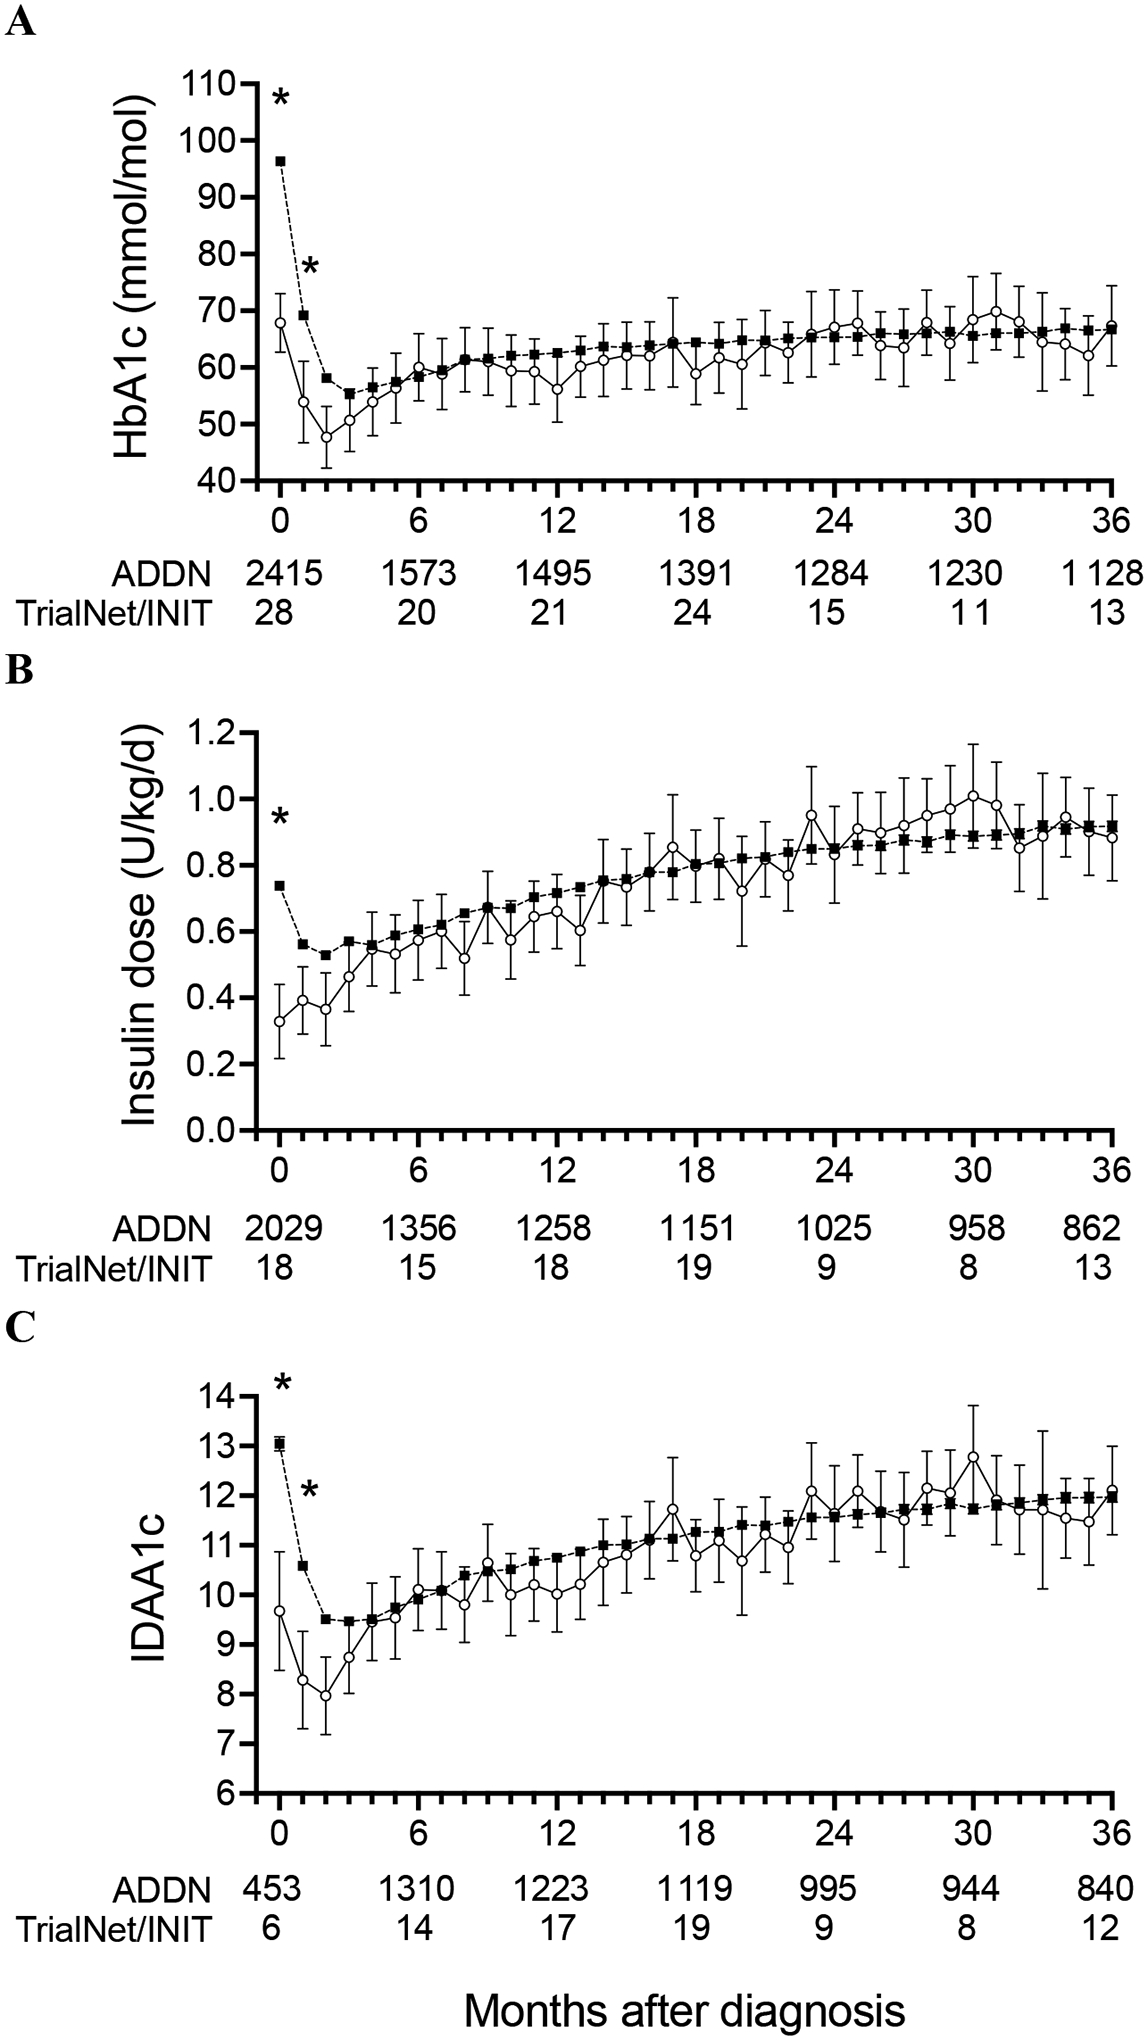
Figure 3. Insulin requirement, HbA1c and beta cell function over three years following diagnosis of stage 3 type 1 diabetes.

Monthly measures of HbA1c (A), insulin dose (B) and IDAA1c (C) for relatives screened in TrialNet/INIT (open circles) and the general population registered in ADDN (filled squares) are shown as predicted mean and 95%CI. The number of individuals contributing to each 6-month data point is provided, with values for each month provided in Supplemental Table S2, with different individuals potentially contributing to different time points. * indicates significant difference (Tukey<0.05) between ADDN and TrialNet/INIT groups at that time point.
