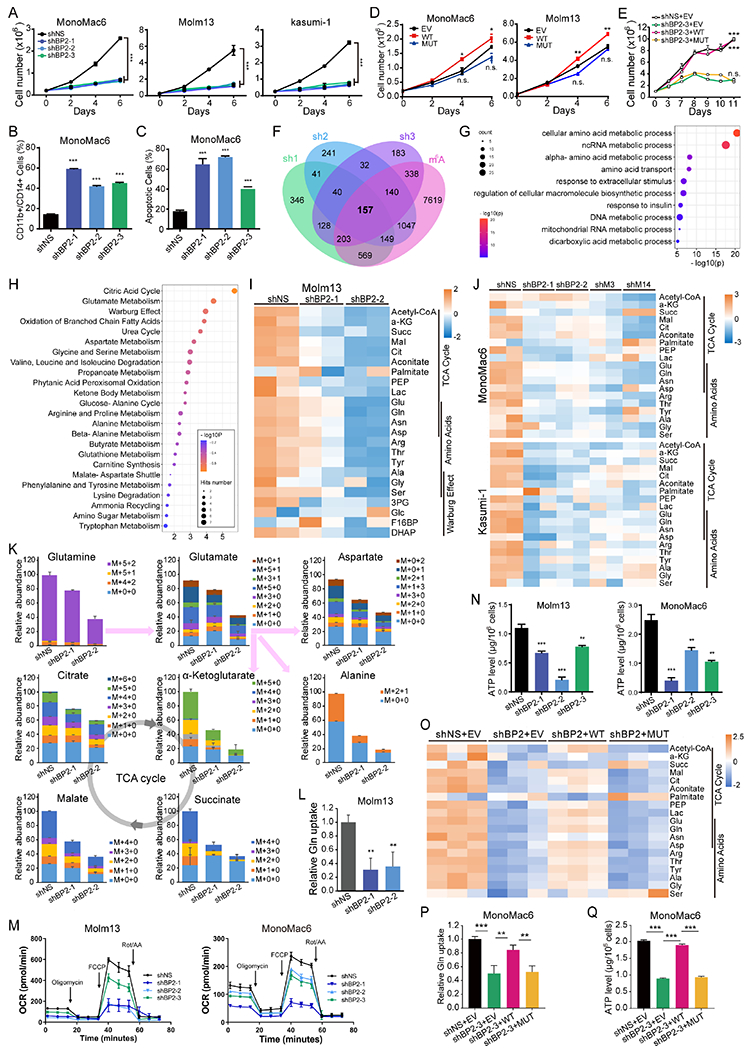
Figure 3. IGF2BP2 regulates glutamine uptake and metabolism in AML cells as an m6A reader.

(A) Viable cell counting of AML cell lines with or without IGF2BP2 KD. (B, C) Flow cytometric analyses of differentiated (CD11b+ or CD14+, B) and apoptotic (Annexin V+, C) cells after IGF2BP2 KD. (D) Viable cell counting of AML cells lentivirally transduced with WT or MUT IGF2BP2 or empty vector (EV). (E) Viable cell counting of MonoMac6 cells transduced with shRNA (shBP2-3) targeting 3’ UTR of IGF2BP2 plus EV, WT, or MUT IGF2BP2-overexpression vector. (F) Venn diagram showing overlapping of significantly (FC<0.667, p<0.0.5) downregulated genes in MonoMac6 cells transduced with different shRNAs targeting IGF2BP2. Information regarding existence of m6A signal or not in MonoMac6 cells (GSE97408) in each transcript was included for analysis. (G) Bubble diagram showing GO enrichment of the 157 candidate targets of IGF2BP2 in (F). (H) Bubble diagram showing enrichment of metabolic pathways by the metabolites with reduced level after IGF2BP2 KD in Molm13 cells. (I, J) Heatmap showing levels of representative metabolites after KD of IGF2BP2 (I), METTL3, or METTL14 (J) in indicated AML cells. (K) Total levels and isotopologue distribution (M+x+y; x, numbers of 13C; y, numbers of 15N) of TCA cycle intermediates and indicated amino acids measured by LC-MS in Molm13 cells transduced with IGF2BP2 shRNAs or shNS and grown in media containing 13C5;15N2-glutamine. (L) Effect of IGF2BP2 KD on glutamine uptake. (M, N) OCR (M) and ATP level (N) changes in AML cells upon IGF2BP2 KD. (O) Heatmap showing levels of representative metabolites in the TCA cycle in IGF2BP2 KD MonoMac6 cells rescued with WT or MUT IGF2BP2. (P, Q) Glutamine uptake (P) and ATP levels (Q) in IGF2BP2 KD cells rescued with WT or MUT IGF2BP2. Data are represented as mean ± SD. **p < 0.01; ***p < 0.001; n.s., not significant; t test. See also Figure S3.
