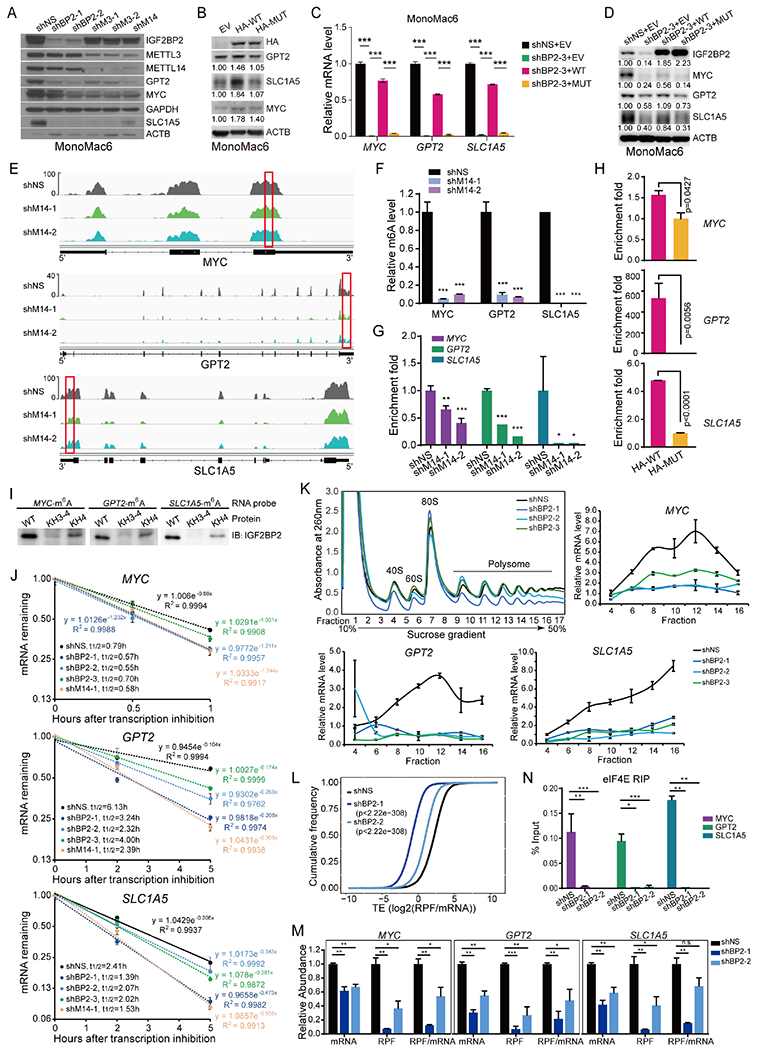
Figure 4. MYC, GPT2, and SLC1A5 are direct targets of IGF2BP2.

(A, B) Western blot showing expression change of MYC, GPT2, and SLC1A5 after KD of IGF2BP2, METTL3, or METTL14 (A), or overexpression of HA-tagged wildtype (HA-WT) or KH3-4 mutated (HA-MUT) IGF2BP2 (B). Band intensity in (B) was quantified by ImageJ2. (C, D) mRNA (C) and protein (D) levels of MYC, GPT2, and SLC1A5 in IGF2BP2 KD cells rescued with WT or MUT IGF2BP2. (E) IGV tracks showing the m6A distribution in indicated transcripts in MonoMac6 cells. Red rectangles depict high-confidence m6A regions for RIP-qPCR validation. (F) Evaluation of relative m6A abundance changes at annotated specific loci in MonoMac6 cells by utilizing Bst DNA polymerase-mediated cDNA extension and qPCR assays. (G) RIP assays using IGF2BP2 antibody were followed by qPCR in METTL14 KD or control MonoMac6 cells. (H) RIP assays using HA antibody were followed by qPCR in U937 cells with ectopically expressed WT or MUT IGF2BP2. (I) RNA pulldown assays using recombinant WT, KH3-4, or KH4 mutated IGF2BP2 protein with m6A-modified RNA oligos corresponding to IGF2BP2 binding sites in MYC, GPT2, and SLC1A5 mRNAs. (J) The mRNA half-life (t1/2) of target genes in MonoMac6 cells with KD of IGF2BP2 or METTL14. (K) Polysome fractionation of MonoMac6 cell lysates (top left) and subsequent qPCR assays. Actb mRNA was used as a reference in qPCR. (L) Cumulative frequency of global translation efficiency (TE) changes upon IGF2BP2 KD in MonoMac6 cells. (M) Relative abundance of MYC, GPT2, and SLC1A5 mRNA, ribosome protected fragment (RPF), and RFP/mRNA in control (shNS) and IGF2BP2 KD MonoMac6 cells from Ribo-seq. (N) RIP assays using eIF4E antibody were followed by qPCR in IGF2BP2 KD or control Molm13 cells. Data are represented as mean ± SD. *, p < 0.05; **, p < 0.01; ***, p < 0.001. t test. See also Figure S4.
