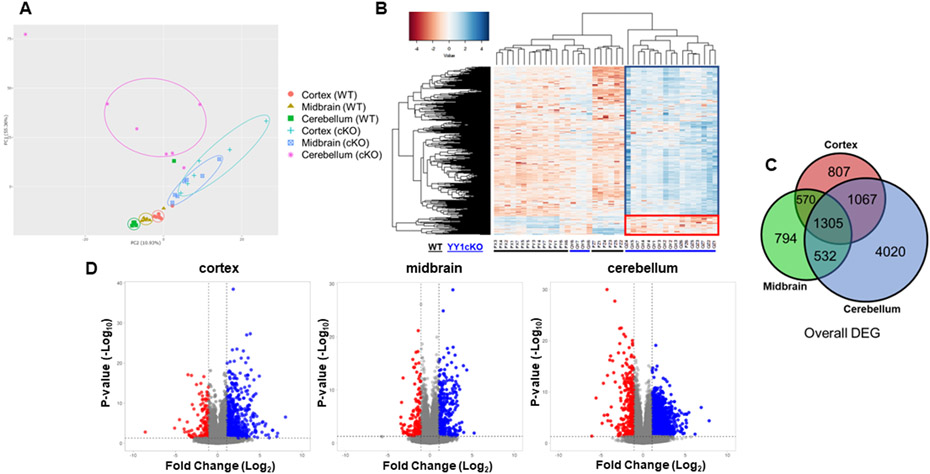
Figure 3. RNA-seq analysis identified differentially expressed genes in the cortex, midbrain, and cerebellum of WT and YY1 cKO mice.
(A) Principal component analysis (PCA) plot of the individual RNA-seq data from cortex, midbrain, and cerebellum of WT and cKO mice. PCA plot showed brain region-specific and astrocytic YY1 deletion-specific differences in gene expression. (B) Heatmap of overall gene expression data between WT and cKO murine cortex, midbrain, and cerebellum. Low (red), no change (white), and high (blue) expression levels are depicted. (C) Venn diagram showed the number of differentially expressed genes (DEG) that are common (shared) in all brain regions and uniquely expressed in the cortex, midbrain, or cerebellum. (D) Volcano plots comparing all genes in the cortex, midbrain, and cerebellum identifies significantly up- or down-regulated in cKO mice. The significance threshold for fold change (log2, twofold change) and p-value (-log10) are shown as black lines on the x- and y-axis, respectively (using DESeq2 statistics, N = 6-7 mice per group).

