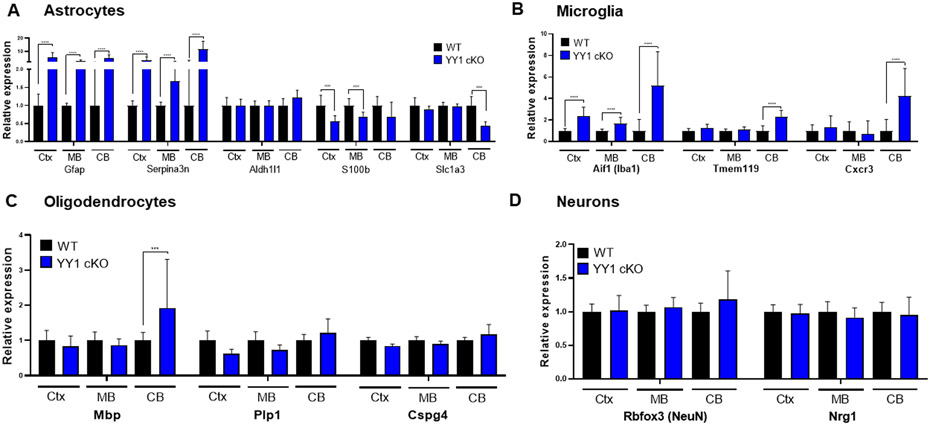
Figure 4. Astrocytic YY1 deletion altered gene expression of neural cell markers in the cortex, midbrain, and cerebellum.
(A-D) Bar graphs of common cell type-specific markers of astrocytes (A), microglia (B), oligodendrocytes (C), and neurons (D) in the cortex, midbrain, and cerebellum. ***, p<0.001; ****, p<0.0001; ####, p<0.0001 compared with the control (WT) (Student t-test, n = 6-7). Data are expressed as mean ± SD.

