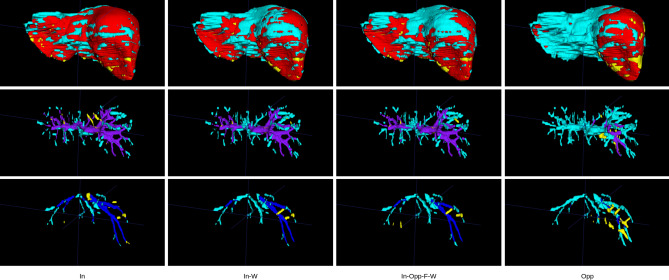
Figure 5.
Comparison of liver segmentation performance with different model inputs: (1) single-modal in-phase (In) in the first column, (2) multimodal in-phase and water reconstruction in the second column (In-W), (3) multi-modal in-phase, opposed-phase, fat, and water reconstructions in the third column (In-Opp-F-W) and (4) single-modal opposed-phase (Opp) in the last column. The correct segmentation is shown in red for the liver parenchyma, purple for the portal veins, and blue for the hepatic veins. Under-segmentation is shown in cyan and over-segmentation in yellow, as performed by the model with an in-phase sequence.

