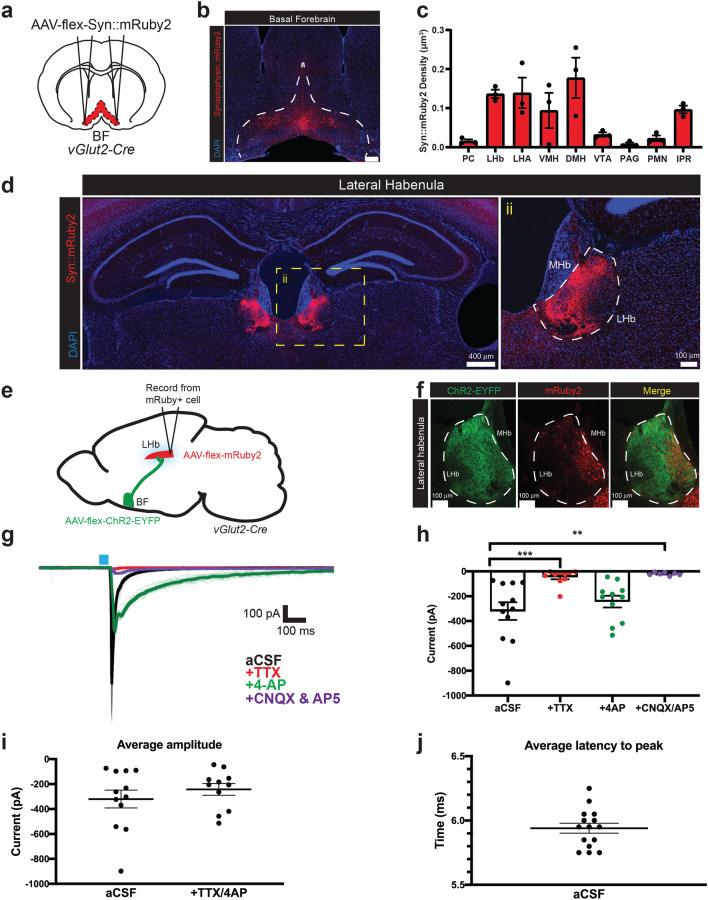
Figure 1.
Glutamatergic BF neurons robustly innervate the LHb and are functionally connected to glutamatergic LHb neurons. (a) Experimental setup for anterograde tracing from vGlut2BF cells. (b) Representative viral targeting of Cre-dependent Synaptophysin::mRuby2 to the basal forebrain (BF, Bregma 0.62). Scale bar = 300 μm. (c) Quantification of different brain regions receiving glutamatergic BF input. Quantification calculated as the density of Syn::mRuby2+ terminals/volume of the ROI. PC, piriform cortex; LHb, lateral habenula; LHA, lateral hypothalamic area; VMH, ventromedial hypothalamus; DMH, dorsomedial hypothalamus; VTA, ventral tegmental area; PAG, periaqueductal gray; PMN, premammillary nucleus; IPR, interpeduncular nucleus. (d) Synaptophysin::mRuby2 projection terminals in the lateral habenula (LHb) (Bregma − 1.82). ii) Zoomed-in inset. MHb, medial habenula. (e) Experimental setup of channelrhodopsin-assisted circuit mapping experiment, stimulating vGlut2+ BF terminals while recording from mRuby+/vGlut2+ cells in the LHb. (f) ChR2-EYFP fibers from the vGlut2BF neurons terminating in the LHb. mRuby+ vGlut2LHb cells in the LHb overlap with ChR2-expressing BF projections. (g) Representative ex vivo electrophysiological trace from mRuby+ cell in the LHb. CSF, cerebral spinal fluid (control). TTX (1 μM), 4-AP (0.5 μM), and CNQX/AP5 (10 μM/ 50 μM) added sequentially. (h) Current measurements (pA) of mRuby+ LHb cells after optogenetic stimulation of BF terminals in (1) aCSF (− 320.20 ± 71.30 pA), (2) + TTX (− 44.20 ± 19.20 pA), (3) + 4AP (− 243.10 ± 47.08 pA) and (4) + CNQX/AP5 (− 20.43 ± 4.64 pA). Error bars represent SEM. Statistically compared using a One-Way ANOVA comparing all groups to the aCSF control group. aCSF vs. TTX: p = 0.0010, aCSF vs. + 4AP: p = 0.5496, aCSF vs. + CNQX/AP5: p = 0.0013. n = 12 for aCSF, n = 10 for TTX, n = 11 for 4AP, and n = 7 for CNQX/AP5. (i) Average amplitude of mRuby+ LHb cells in aCSF and with the addition of both TTX and 4AP. Error bars represent SEM. n = 12 and 11, respectively. aCSF = − 320.20 ± 71.30 pA, + TTX/4AP = − 243.10 ± 47.08 pA. Statistically compared using an unpaired t-test, p = 0.3859. (j) Average latency to 10% of the max current of mRuby+ LHb cells upon photostimulation of BF terminals (5.940 ± 0.04 ms). Error bars represent SEM. n = 15.

