Figure 3.
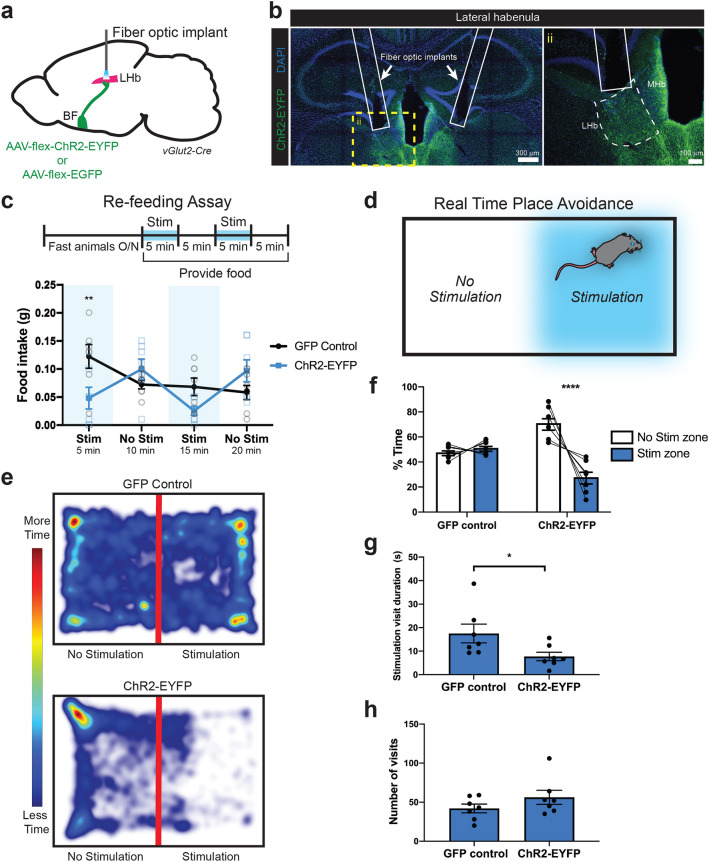
Activation of lateral habenula-projecting glutamatergic basal forebrain neurons reduces food intake and drives aversion. (a) Experimental setup for in vivo optogenetic behavior, in which vGlut2BF terminals in the LHb are activated. (b) Representative images showing fiber optic implant targeting BF terminals in the LHb. Images taken at Bregma − 1.46. ii) Zoomed-in inset. (c) Experimental timeline for re-feeding assay with and without optogenetic stimulation of vGlut2BF→LHb cells. Average food intake (g) of chow measured in 5 min stim/no stim intervals throughout the duration of a 20 min re-feeding experiment. Solid symbols represent averaged values, while hollow/transparent symbols represent individual values biological replicates. Statistical significance calculated using repeated measures two-way ANOVA with Sidak correction for multiple comparisons. Error bars represent SEM. n = 7. At 5 min stim time period: GFP controls = 0.12 ± 0.021 g, ChR2 animals = 0.05 ± 0.019 g, p = 0.0078. At 10 min non-stim time period: GFP controls = 0.07 ± 0.008 g, ChR2 = 0.100 ± 0.018 g, p = 0.6608. At 15 min stim time period: GFP controls = 0.07 ± 0.016 g, CHR2 = 0.03 ± 0.008 g, p = 0.2345. At 20 min non-stim time period: GFP controls = 0.06 ± 0.013 g, ChR2 = 0.097 ± 0.020 g, p = 0.3297. (d) Experimental setup for real-time place avoidance assay with optogenetic stimulation. (e) Heat maps showing movement of representative GFP control and ChR2-EYFP mice during the real-time place avoidance assay in which mice were stimulated on the right side of the chamber. Heat maps generated using Noldus Noldus EthoVision (XT 16; https://www.noldus.com/ethovision-xt) software. (f) Average percent time GFP controls and ChR2-EYFP expressing animals spent in non-stimulation or stimulation sides of the arena during a 20 min experiment. Statistical significance determined using Binomial test for proportion with Bonferroni correction; null hypothesis = 50%. Error bars represent SEM. n = 7. For GFP controls, they spent 47.68 ± 1.98% of their time in the non-stim side and 51.32 ± 1.97% in the stim side, p = 0.7644. For ChR2: 71.07 ± 4.70% time in non-stim side, 27.84 ± 4.82% in stim side, p < 0.0001. (g) Average duration of each visit to the stimulation side of the chamber. Statistical significance determined using unpaired, two-tailed t-test. GFP controls = 17.50 ± 3.98 s, ChR2 = 7.71 ± 1.79 s, p = 0.0447. n = 7. (h) Number of visits to the stimulation zone. Statistical significance determined using unpaired, two-tailed t-test. GFP controls = 42.00 ± 5.52 visits, ChR2 = 56.29 ± 9.05 visits, p = 0.2026 (not significant). n = 7.

