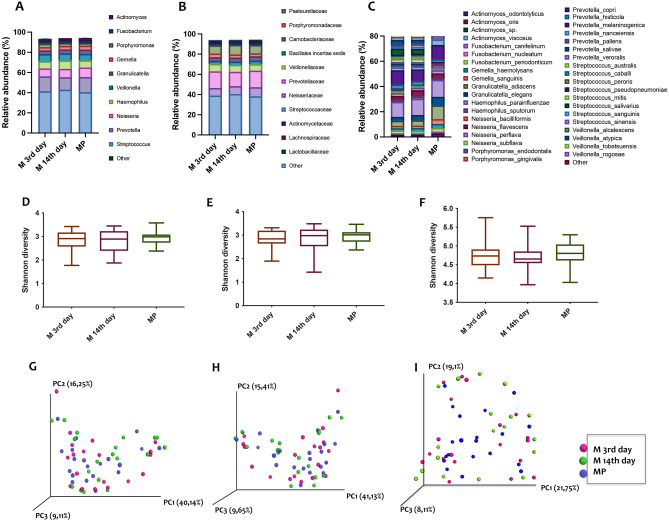
Figure 2.
Differences in abundances of taxa in salivary samples from women with menstrual cycle at 3rd and 14th day (M-3rd day and M-14th day) and in menopause (MP) (A, B, C) and alpha-and beta-diversity comparisons of the gut microbiomes of each group (D–I). (A) Relative abundances of genera, (B) families and specie (C). (D-F) Boxplot of the Shannon diversity of each group. (G-I) Principal coordinate analysis of Bray–Curtis distances. The colors of the boxplots and dots represent the different groups analyzed according to the legend.

