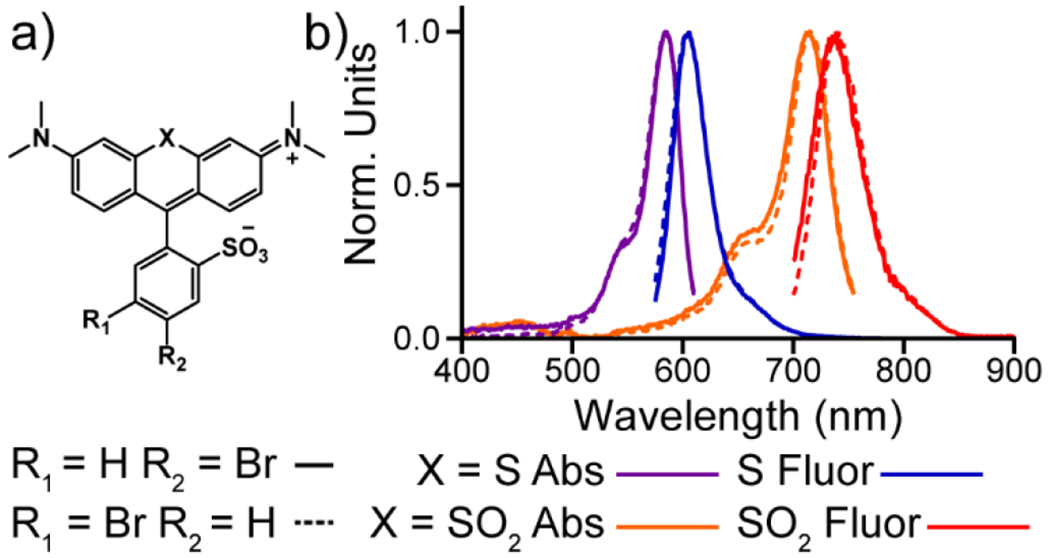
Figure 1.

Absorbance and emission spectra for sulfide and sulfone rhodamines. a) Structures of sulfide and sulfone rhodamines. b) Normalized absorbance (purple, orange) and emission (blue and red) spectra for sulfide (3 and 4) and sulfone (5 and 6) rhodamines. All spectra were obtained at 1 μM dye concentration in a TBS (50 mM Tris-HCl, pH 7.4, 0.1 M NaCl) solution containing 0.1 % (w/w) SDS. All spectra were normalized to their respective maxima.
