
Figure 2.
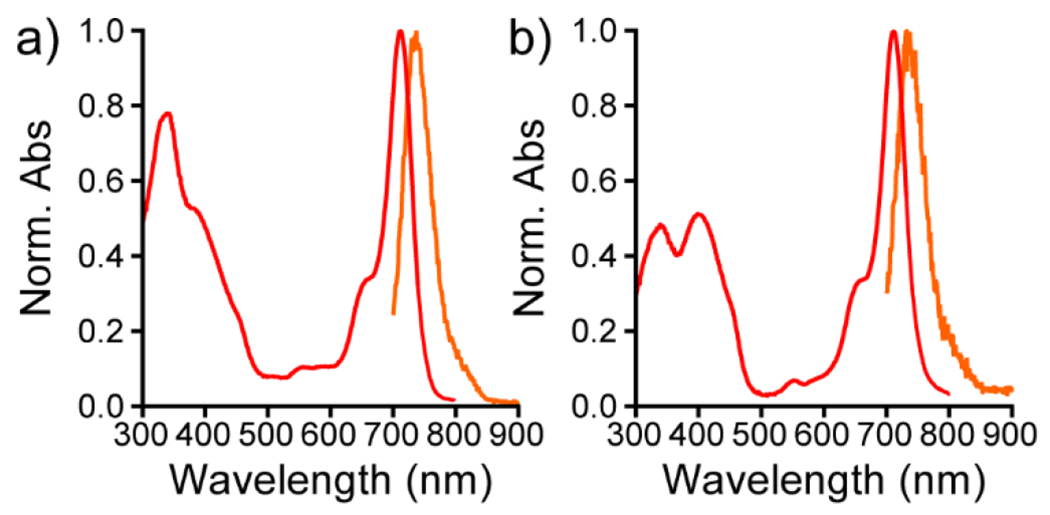
Absorbance and emission spectra for sulfone RhoVRs. Normalized absorbance (red) and emission (orange) spectra for a) SuRhoVR 9 and b) SuRhoVR 10. All spectra were obtained at 1 μM dye concentration in a TBS (50 mM Tris-HCl, pH 7.4, 0.1 M NaCl) solution containing 0.1 % (w/w) SDS. All spectra were normalized to their respective maxima.