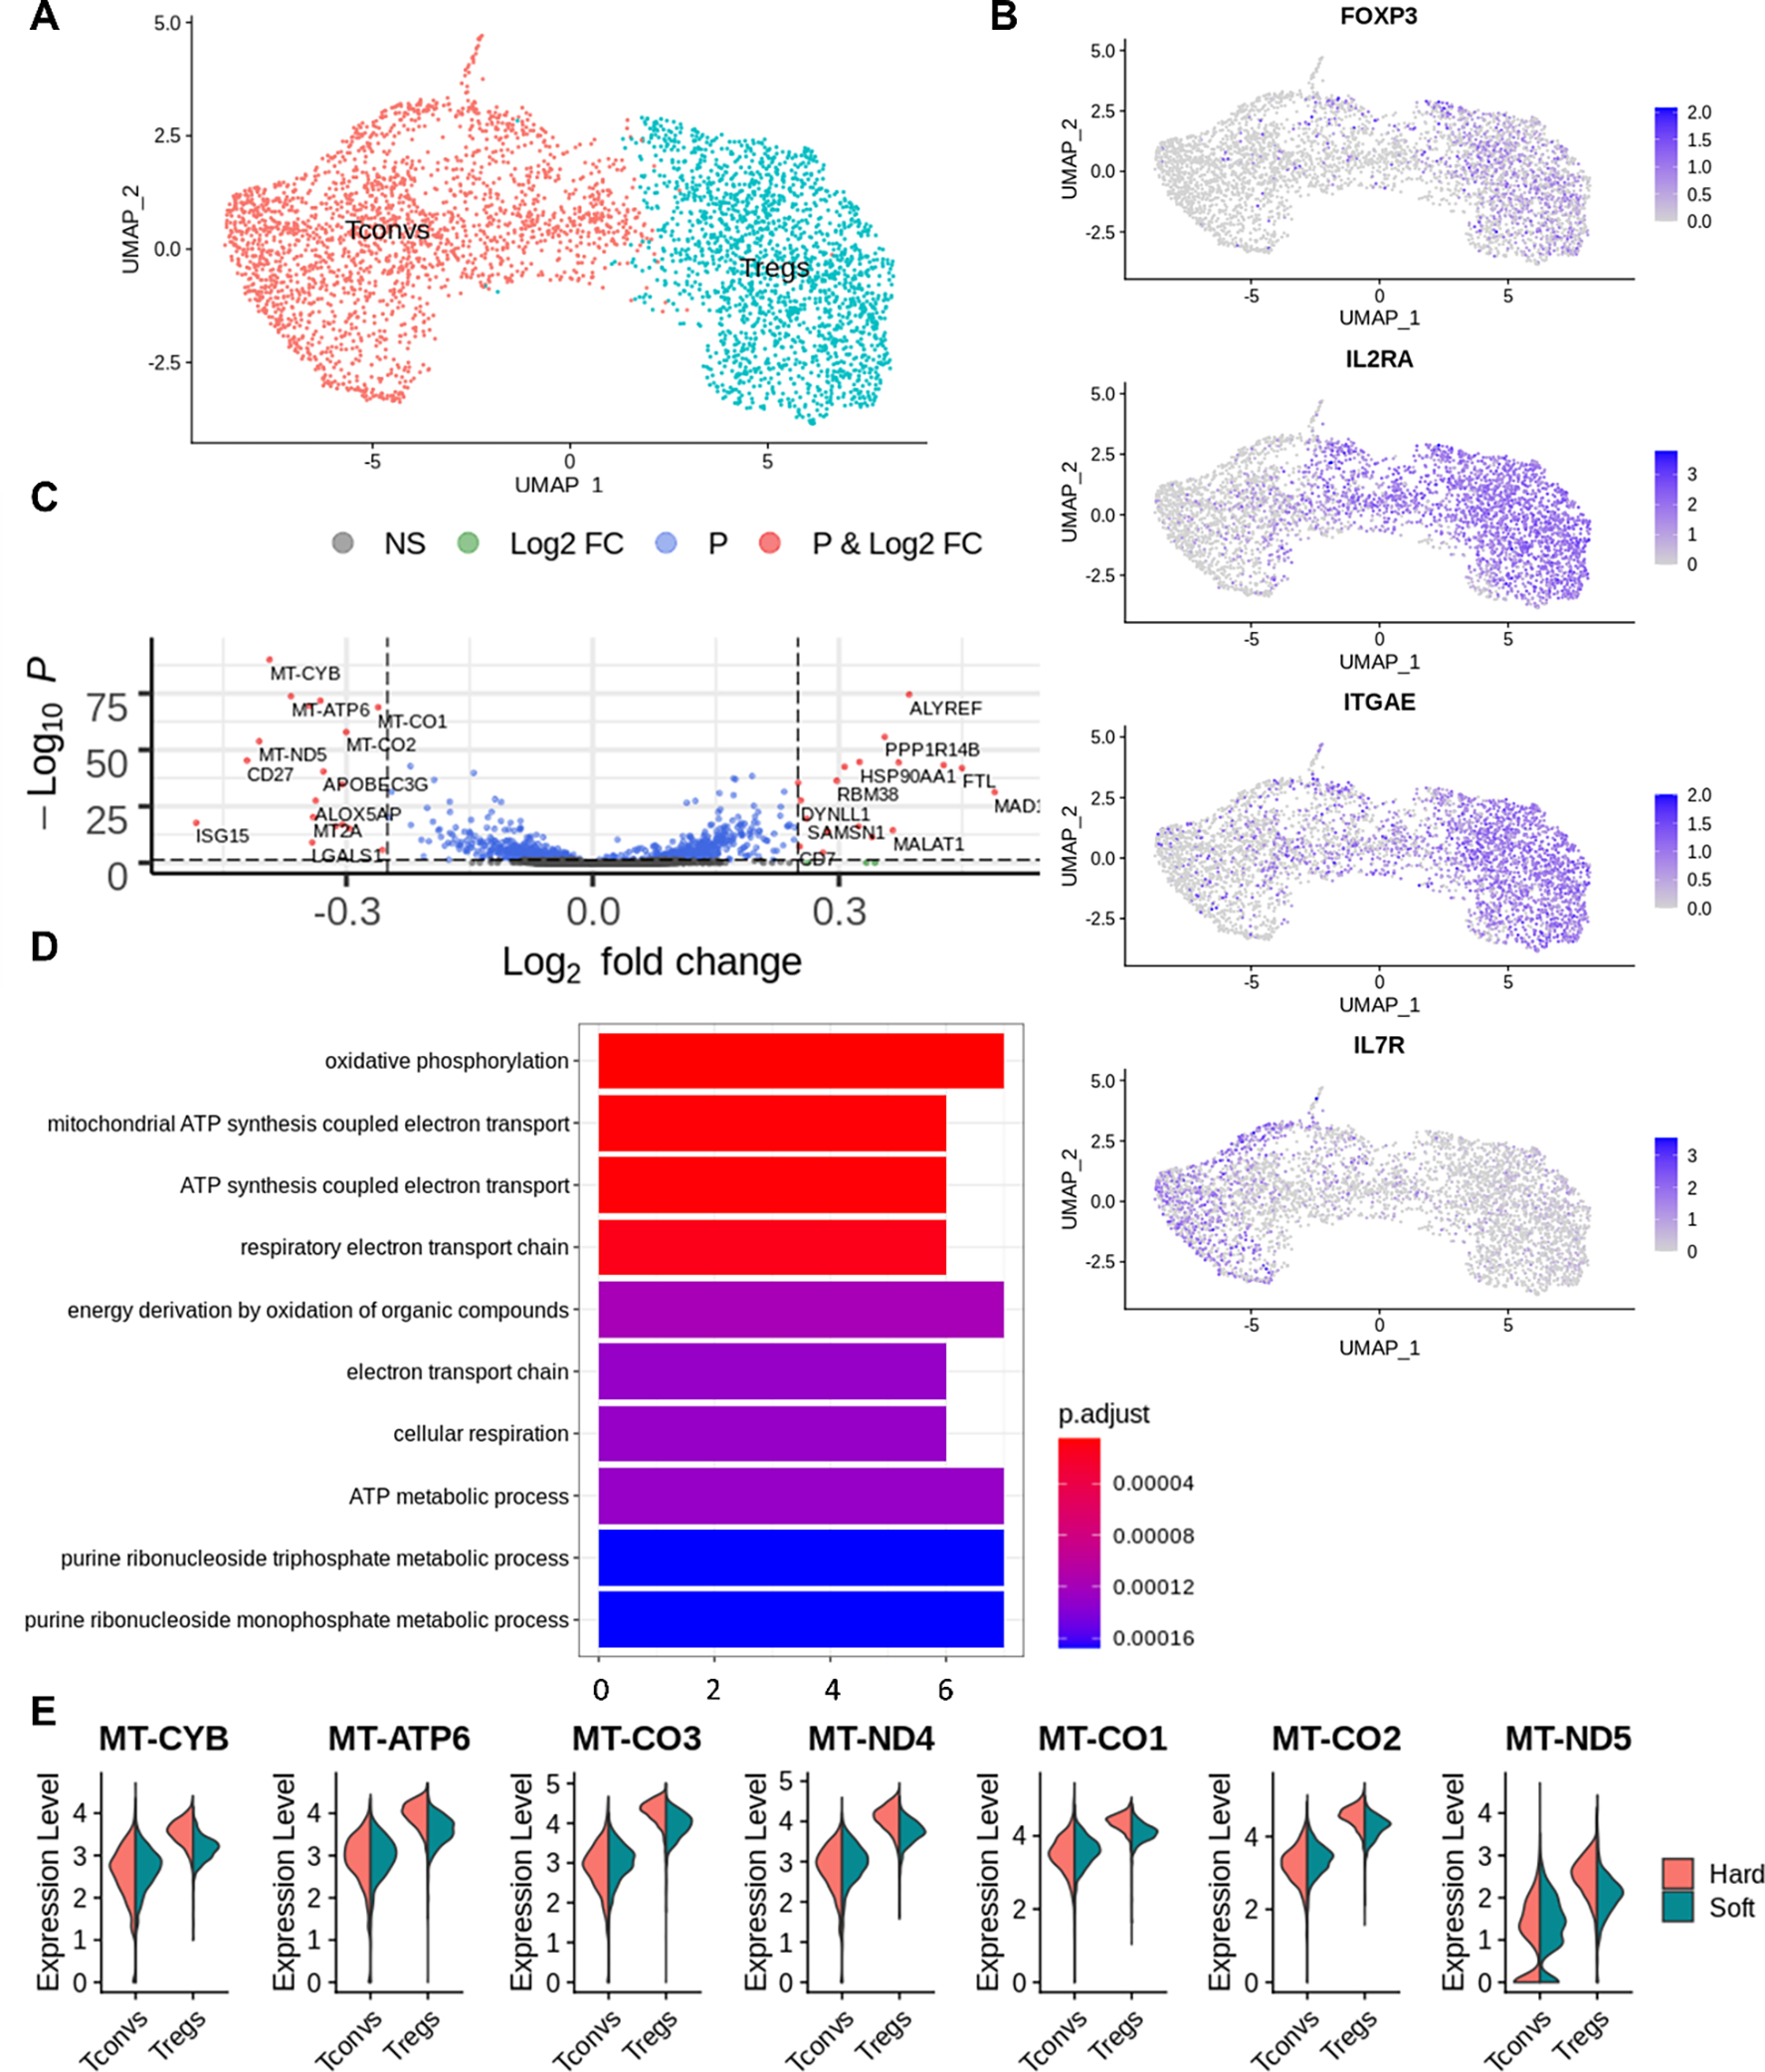
Figure 2.

Clustering and differential expression analysis of Tregs with Seurat. (A) Cells were clustered into 2 populations in Seurat. (B) FOXP3, IL2RA, ITGAE, IL7R expression on both hard and soft samples’ UMAP projection. (C) Volcano plot of differentially expressed genes from Tregs comparing the stiffer sample to the softer sample. (D) Over-representation analysis of differential expressed genes from Tregs when comparing the soft and hard samples. (E) Violin plot of differentially expressed genes from (C) involved in oxidative phosphorylation.
