Figure 3.

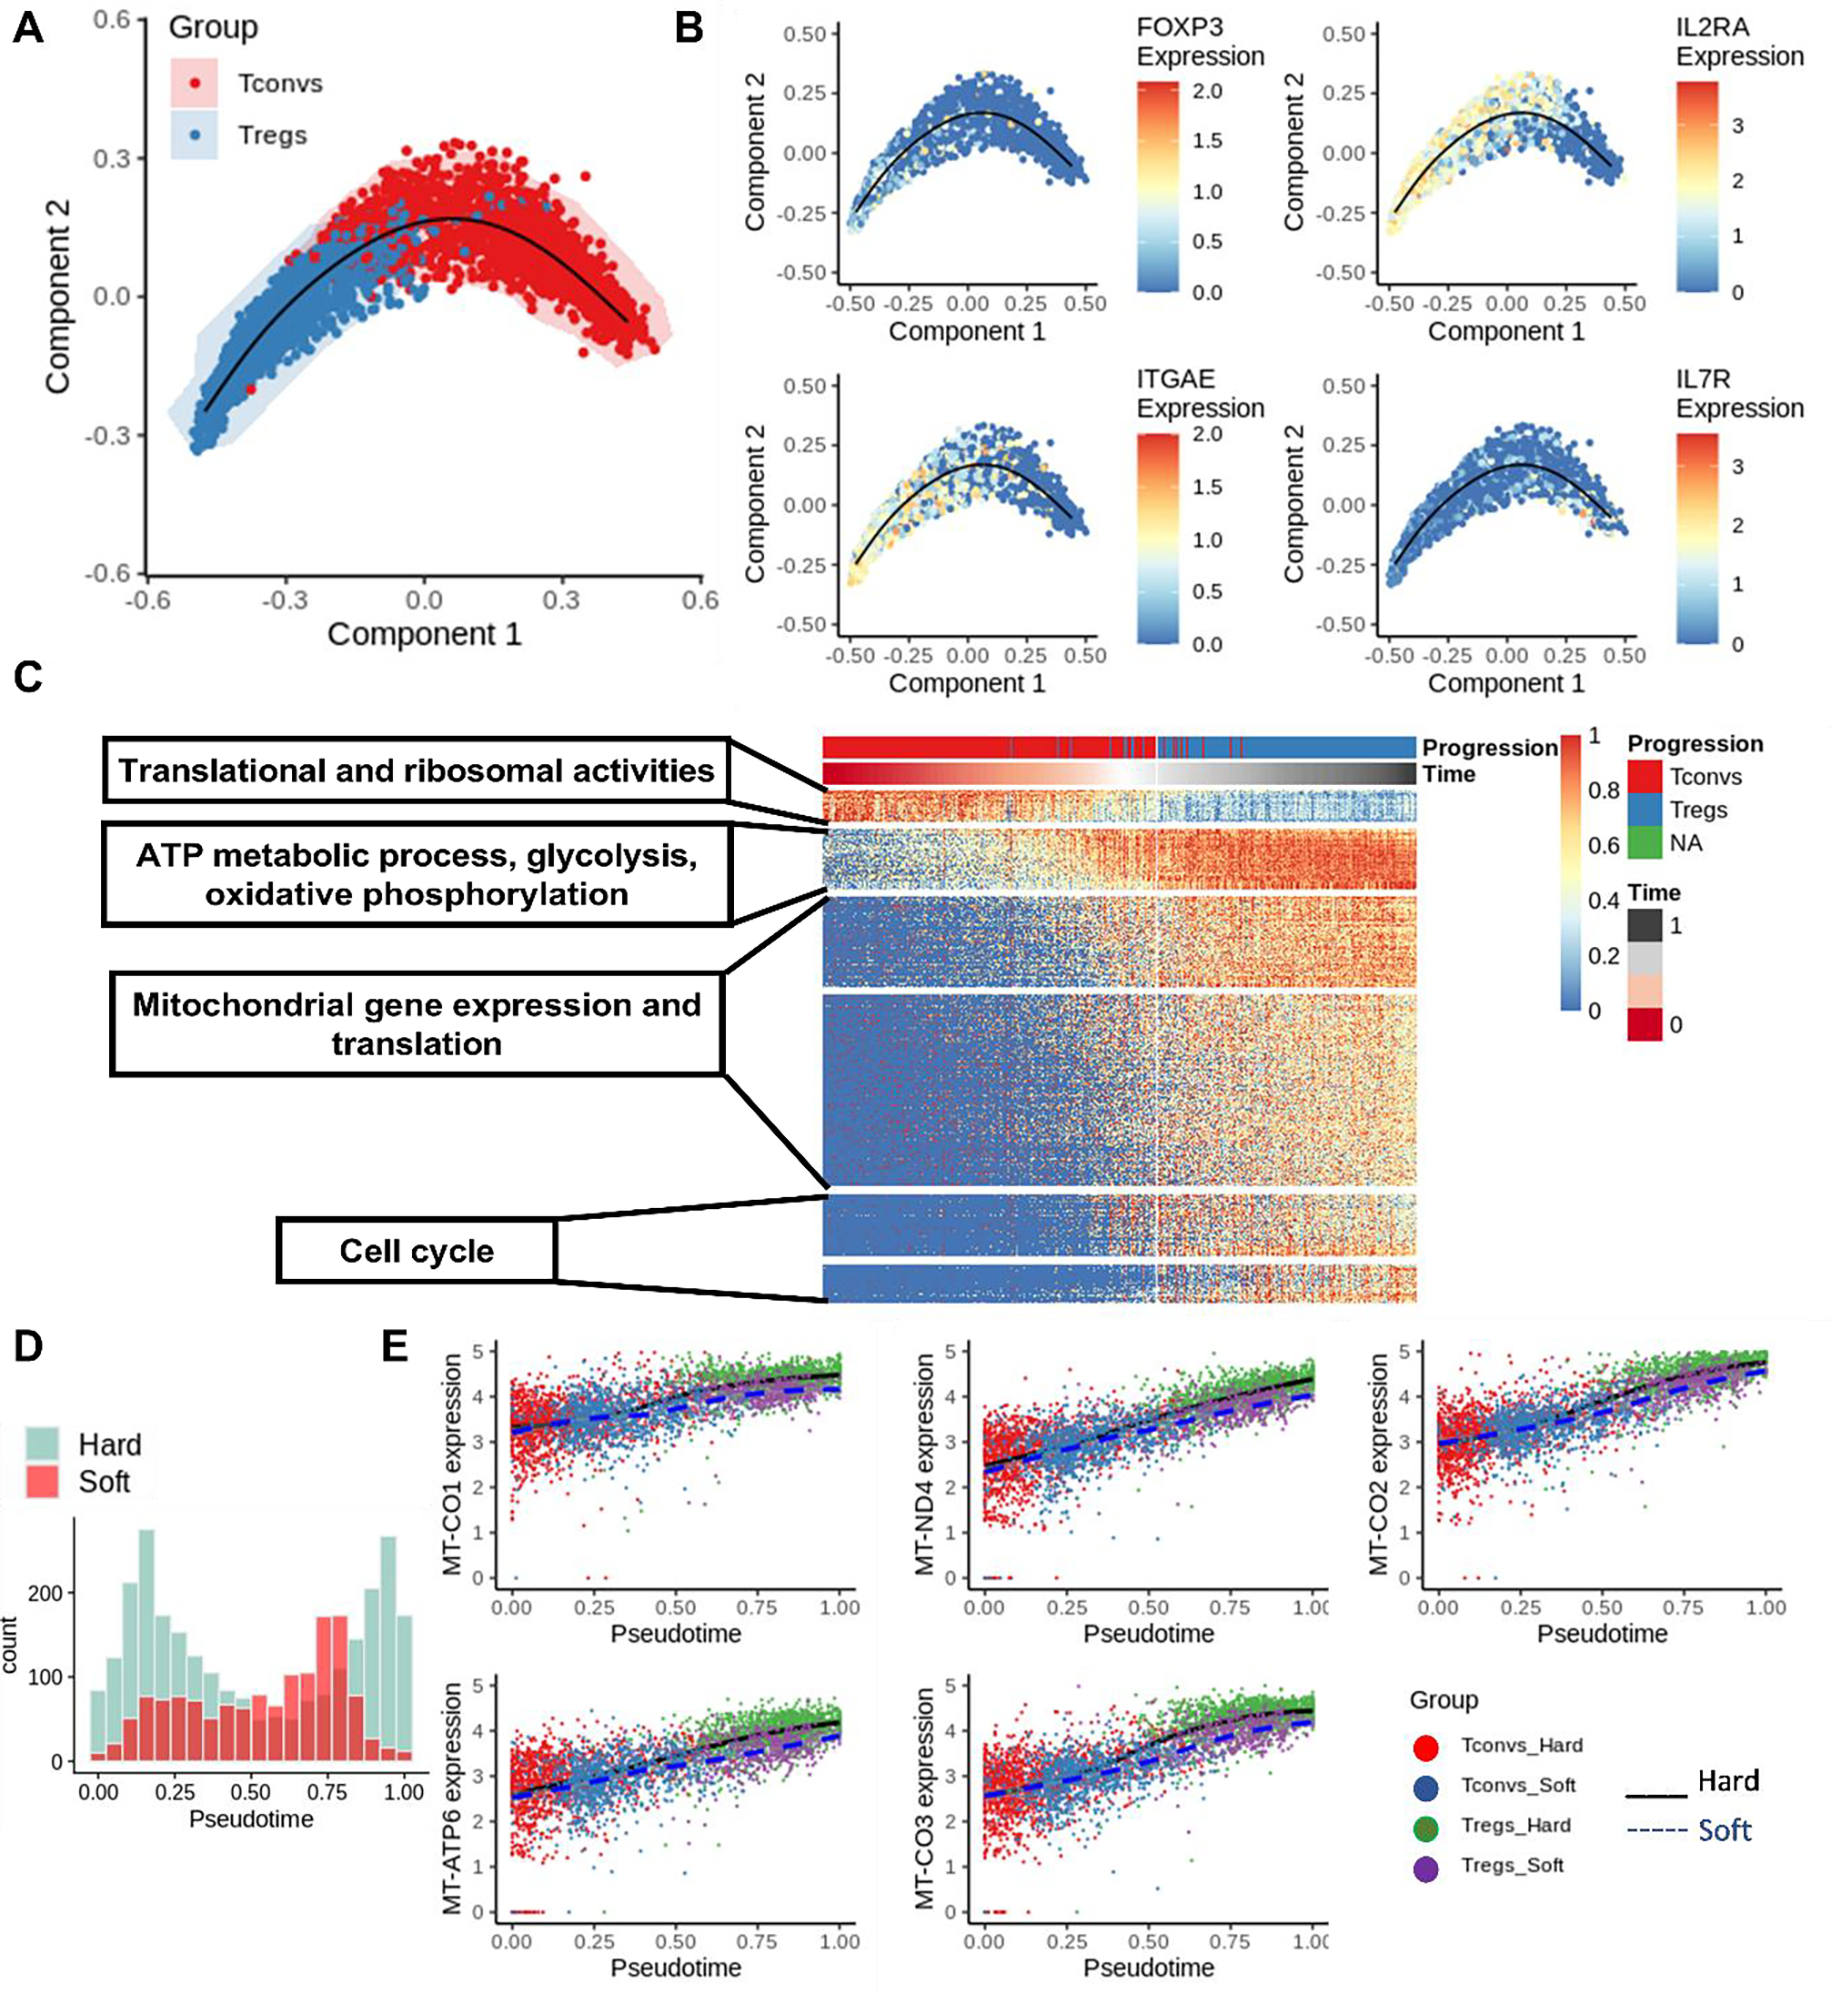
Trajectory analysis of Treg induction with SCORPIUS. (A) Trajectory analysis was performed with SCORPIUS with T cells from both hard and soft samples combined. (B) Treg signatures were plotted on the embedding from SCORPIUS. (C) Important genes that contribute to Treg induction were organized into different modules (p.adjust <0.05). (D) Histogram of cells along the trajectory on soft and hard samples, respectively. (E) The expression of mitochondrial genes was plotted along with the pseudotime projection.
