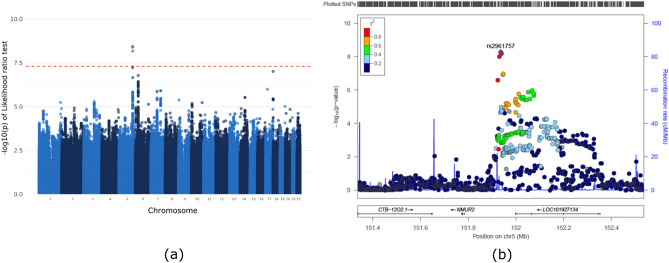
Figure 2.
GWAS results for the Korean dataset. (a) Manhattan plot of the likelihood ratio test of the SNPs from chromosomes 1 to 22. (b) Expanded Manhattan plot of the 800 kb region shows both genotyped and imputed SNPs. rs2961757, which was the most significant SNP, and is indicated in purple, and other SNPs are colored according to their r2 value relative to that of rs2961757. NMUR2 and LOC101927134 genes are located in this range.

