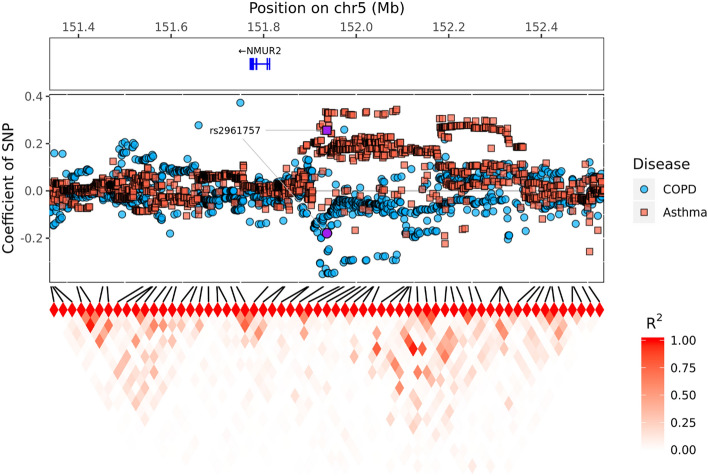
Figure 3.
SNP coefficients for Asthma and COPD disease in the target region. The top box shows the located coding gene in the target region. The middle box represents the coefficients of SNPs. The red and blue squares represent the coefficients of SNPs for the asthmatic patients and controls and the COPD patients and controls, respectively. The tile graph at the bottom shows the correlation between the genotyped SNPs, and the amount of correlation is shown by the darkness of the red color.

