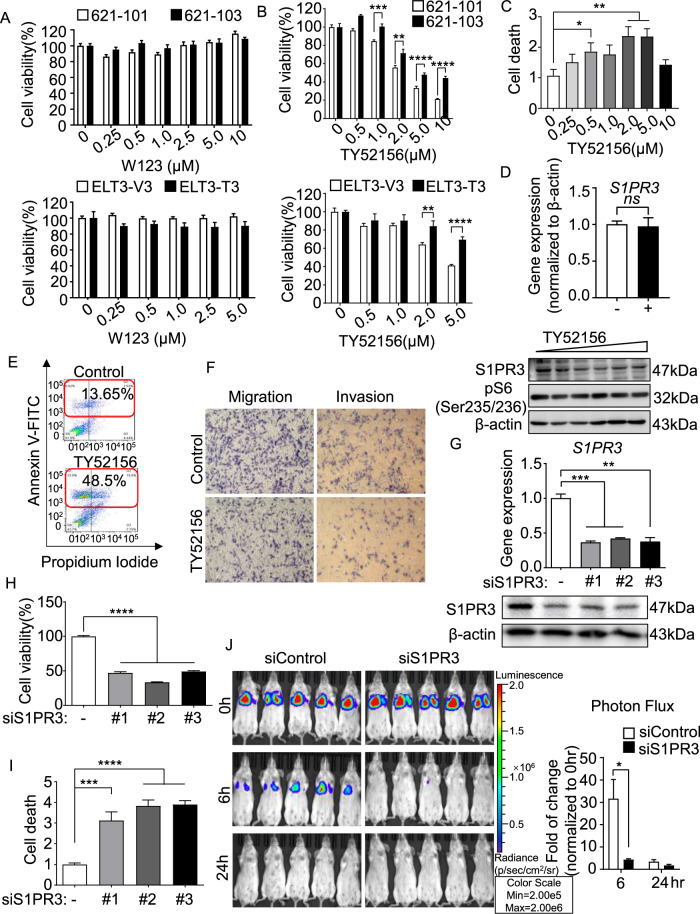
Fig. 5. Blocking S1PR3 decreases the survival of TSC2-deficient cells in vitro and in vivo.
A, B Viability of 621-101 and 621-103 cells (upper panel) and ELT3-V3 and ELT3-T3 cells (lower panel) treated with the S1PR1 inhibitor W123 (A) or S1PR3 inhibitor TY52156 (B) at the indicated concentrations for 24 h was measured by MTT assay. (C) The death rate of 621-101 and 621-101 cells treated with TY52156 at the indicated concentrations for 24 h was measured by PI/CV assay. A–C Results are representative of eight independent samples per group. D The mRNA level of S1PR3 detected by RT-qPCR (upper panel) and the protein expression of S1PR3 and phosphor-S6 (235/236) detected by immunoblotting (lower panel) in vehicle control or TY52156-treated 621-101 cells were analyzed. E 621-101 cells treated with vehicle control or TY52156 (2 μM) were stained with Annexin V: FITC apoptosis detection kit reagent. Cell death was analyzed by flow cytometry (n = 3). F Migration (left panel) and invasion (right panel) of 621-101 cells treated with vehicle control or TY52156 (2 μM) were detected in Transwell chambers without or with Matrigel. G 621-101 cells were transfected with three independent S1PR3 siRNAs (#1, #2, or #3) or the negative control (siControl). The mRNA and protein levels of S1PR3 were determined using RT-qPCR (upper panel) and immunoblotting (lower panel). H, I Viability (H) and death rate (I) of 621-101siControl and 621-101siS1PR3 (#1, #2, or #3) cells were measured by MTT or PI/CV assay. The results are representative of eight independent samples per group. J 621-101siControl and 621-101siS1PR3 cells stably expressing the luciferase tag were injected intravenously into SCID mice (n = 5). Lung colonization was quantified using bioluminescence intensity 0 h, 6 h, and 24 h post injection. Luminescence color scale: 0 h, 6 h, and 24 h (min = 2 × 10⁵, max = 2 × 10⁶). The statistical analysis (right panel) indicates the relative fold change in photon flux. The results are representative of five mice per group. Student’s t test, *P < 0.05, **P < 0.01, ***P < 0.001, and ****P < 0.0001.

