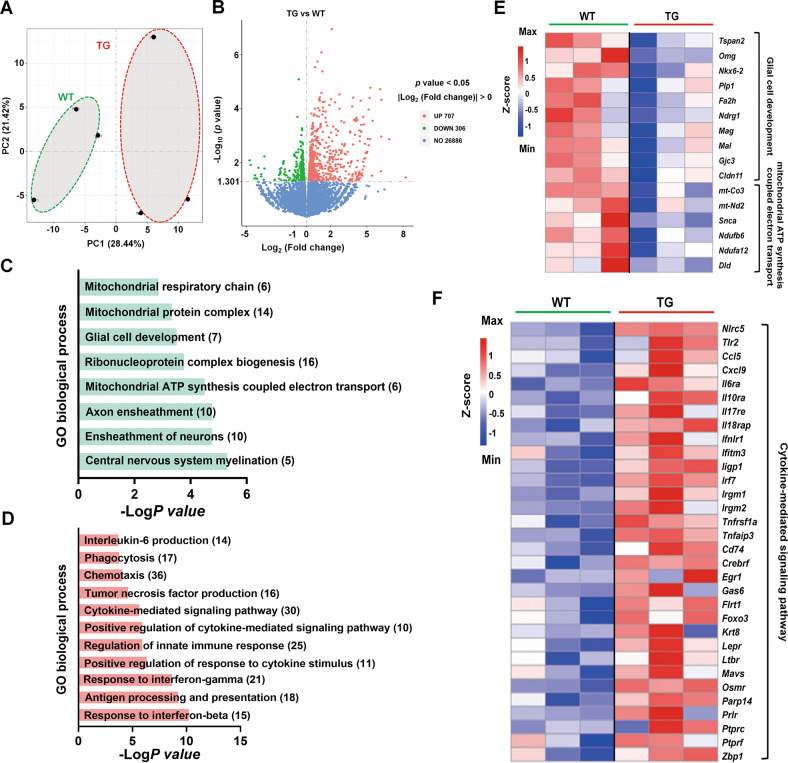
Fig. 7. Transcriptome analysis of G82R/L85P variant knock-in mice.
A PCA score plots revealed a distinct separation between components in WT and TG mice. B DEGs between WT and TG mice are shown in a volcano plot. C, D The representative GO pathways enriched by down- and up-regulated DEGs between WT and TG mice are shown. E Downregulated DEGs enriched in “Glial cell development” and “Mitochondrial ATP synthesis coupled electron transport” pathways are shown. F Upregulated DEGs enriched in the “Cytokine-mediated signaling pathway” are shown.

