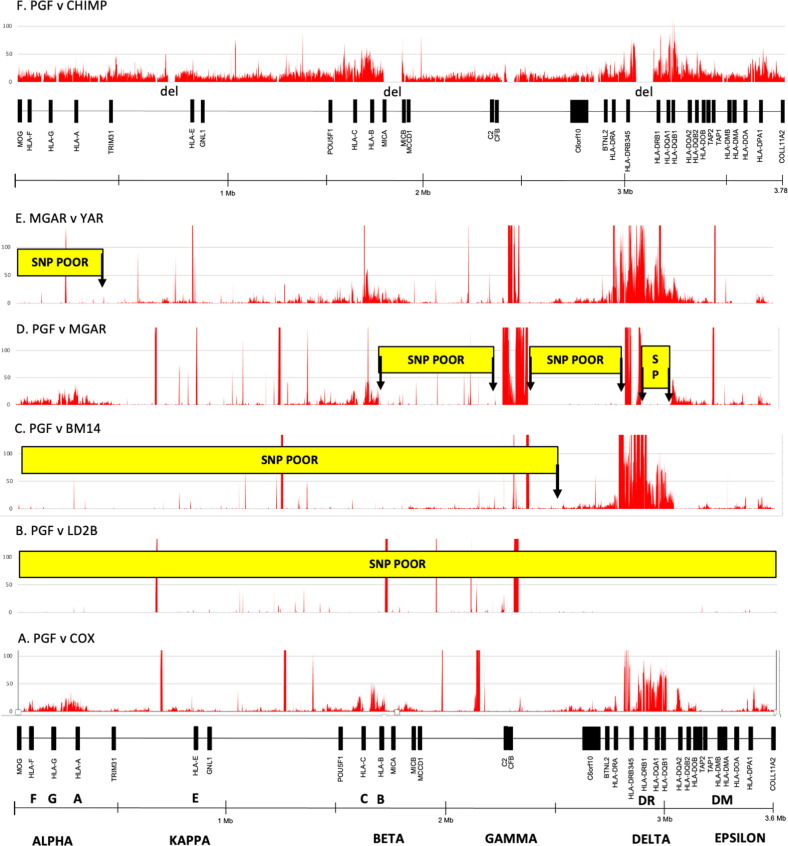
Fig. 2. SNP or SNV density plots between different paired alignments of MHC haplotypes represented by six homozygous cell-lines, PGF, COX, LD2B, BM14, MGAR, YAR and a chimpanzee (CHIMP) genomic reference sequence, GCF_002880755.1 (Clint_PTRv2).
The MHC gene markers and genomic distances (Mb) from left to right between the MOG and COL11A2 genes, and the regions of polymorphic frozen blocks known as alpha, kappa, beta, gamma, delta and epsilon (Dawkins et al.10, Shiina et al.2), are shown at the bottom of the Figure. The four SNP plots (A–D) are between the haplotype PGF: A*03:01-C*07:02-B*07:02-DRB1*15:01-DQA1*01:02-DQB1*06:02 and the haplotypes of A COX: A*01:01-C*07:01-B*08:01-DRB1*03:01-DQA1*05:01-DQB1*02:01:01, B LD2B: A*03:01-C*07:02-B*07:02-DRB1*15:01-DQA1*01:02-DQB1*06:02, C BM14: A*03:01-C*07:02-B*07:02-DRB1*04:01-DQA1*03:01-DQB1*03:02 and D MGAR: A*26:01-C*07:01-B*08:01-DRB1*15:01-DQA1*01:02-DQB1*06:02. The fifth SNP plot (E) is between the haplotype MGAR (see D) and YAR: A*26:01-C*12:03-B*38:01-DRB1*04:02-DQA1*03:01-DQB1*03:02. In F, the SNV plot is between the PGF reference sequence (CZUC02000001.1) and the chimpanzee (CHIMP) genomic reference sequence, GCF_002880755.1. The SNV regions label ‘del’ are genomic sequence regions absent from CHIMP sequence. The Chimpanzee MIC gene in the beta block is a hybrid of human MICA and MICB53,62. The Y-axis presents the number of SNP/kb (window size). The X-axis shows the SNP density positions (SNP/kb) across 3.6 Mb of genomic sequence between the MOG and COL11A2 genes. The red vertical lines along the X-axis that are above 100 on the Y axis are artifactual sequences or those representing sequence gaps, poor assembly, inversions or long runs of unspecified nucleotides. The yellow horizontal boxes labelled SNP POOR are regions of recombination (highly conserved nucleotide sequence with little or no SNPs between sequence alignments). In this context, the SNP POOR regions are those that are <1 SNP/kb, in contrast to the same regions that are SNP rich (>1 SNP/kb) in other haplotype sequence comparisons. The MHC class III and most FW genes in the class I region are always SNP poor, and consequently were not labelled as such in A, D or E. The ends of the ‘SNP POOR’ boxes represent regions of putative crossovers (vertical arrows) between SNP poor and SNP rich regions of different haplotypes in C–E. In B, PGF v LD2B shows the relative absence of SNPs across 3.6 Mb between two conserved (highly similar sequences) haplotypes. Extended genomic regions (>50 kb) with 1-50 SNP/kb are considered to be SNP rich regions, whereas extended regions of < 1 SNP/kb are SNP poor regions. The SNPs within SNP poor regions were easy to count manually because of small numbers (<0.1 SNP/kb), whereas SNP rich regions were difficult to count because of larger numbers at an average of 7 SNP/kb in the alpha block (320 kb), and up to 50 SNP/kb or greater in the delta block (185 kb) depending on haplotype comparisons. In the alpha block, the highest average SNP density between seven different haplotypes was 16 SNP/kb near HLA-A with the lowest density at ~2 SNP/kb near the HLA-J pseudogene13. The SNP count was <0.001 SNP/kb between the same HLA-A haplotypes in C and D. Spikes and peaks of SNPs above 100 SNP/kb were due mostly to nucleotide misalignments because of poor sequence assembly, structural variations, gaps, inversions or long runs of unspecified nucleotides. See recent SNP plots by Houwaart et al.49 for additional comparisons between MHC haplotypes.

