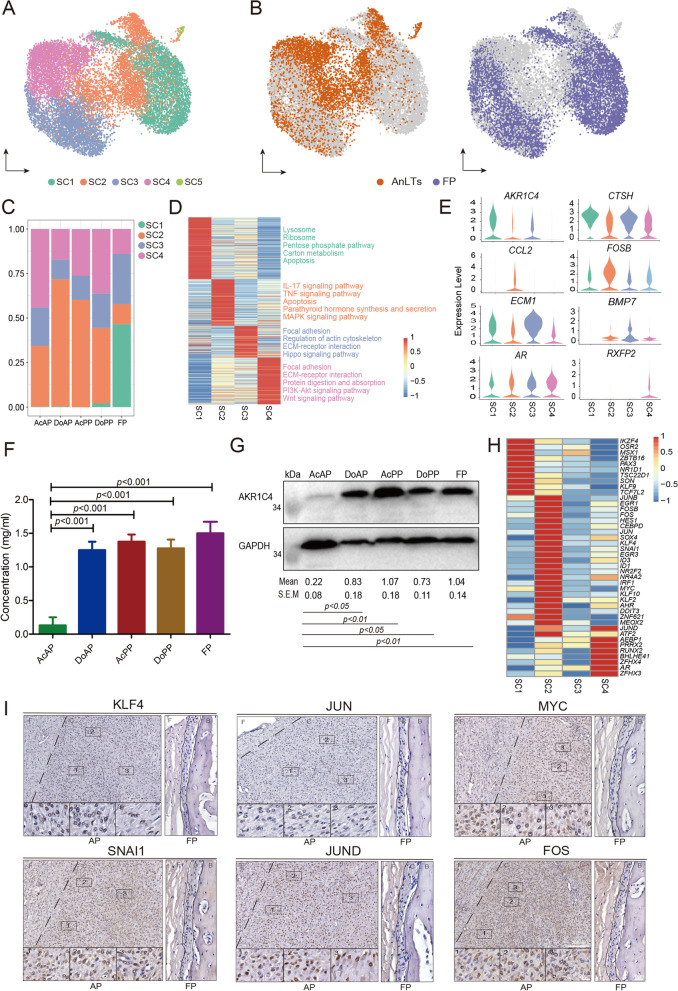
Fig. 3.
THY1+ cell subclusters in AnLTs and FP. A UMAP plot to visualize the five subclusters (SC1, SC2, SC3, SC4 and SC5) of THY1+ cells. B UMAP plot to visualize the distribution of THY1+ cell subclusters in the AnLTs and FP, respectively. The left panel: THY1+ cells of the AnLTs in orange, and the right panel: THY1+ cells of the FP in purple. C Bar plot to show the proportion of each THY1+ cell subcluster in the five tissue types. D Heatmap plot to show the average expression levels of the DEGs in the four THY1+ cell subclusters (SC1-SC4). The descriptions right to the heatmap are the top KEGG enriched pathways (adjust p value < 0.05). E Violin plots to show the expression levels of eight key genes in the four THY1+ cell subclusters (SC1-SC4). F Enzymatic activities of AKR1C4 of the five tissue types, were determined via enzyme-linked immunosorbent assay. Value: mean ± S.E.M. n=3. G Immunoblots of AKR1C4 protein of the five tissue types and internal reference protein (GAPDH). Relative intensity of each immunoblot was calculated using Image J. Value: mean ± S.E.M. n=3. H Heatmap plot to show the expression levels of the differentially transcriptional factors in the four THY1+ cell subclusters. I IHC staining of six key transcriptional factors in the AP and FP tissues, respectively. Note that numerous positively stained cells (brown) were found in the AP, but not in the FP. AP, antlerogenic periosteum; FP, facial periosteum; F, fibrous layer; C, cellular layer; B, bone

