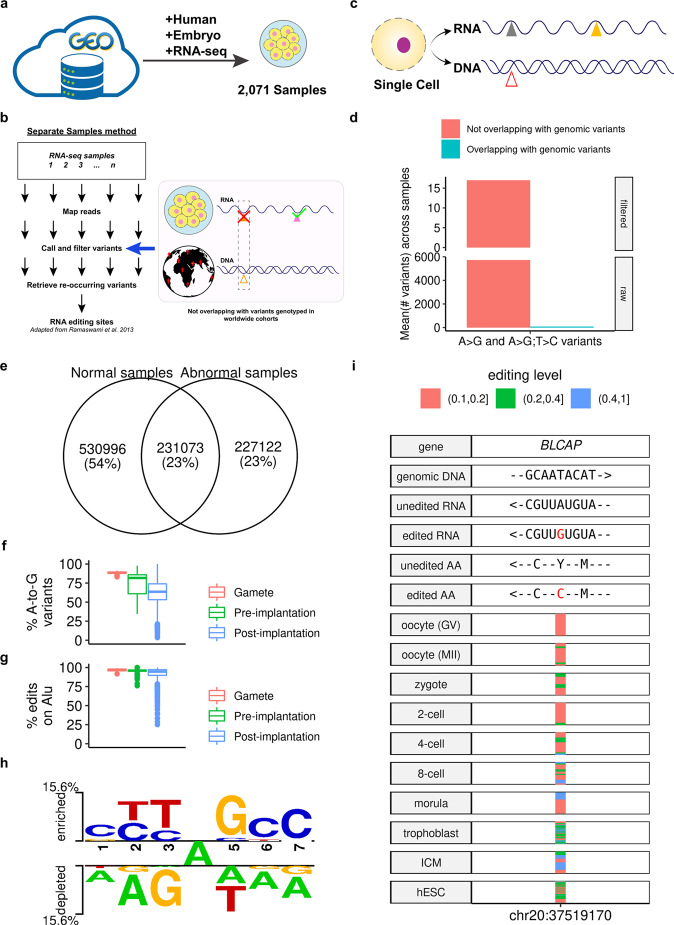
Fig. 1. Identification and validation of the A-to-I editome for human embryos.
a Overview of RNA-seq curation from the public databases. b Overview of the adapted stringent pipeline. c, d The pipeline yielded a zero ratio of identified A-to-I RNA edits that overlapped with the DNA variants in the same cell across samples (d) in a paired DNA-RNA-sequencing dataset for single cells (c). The “#” denotes count. Also, see Supplementary Fig. 2 for the distribution of all possible types of nucleotide changes and the ADAR-binding motif derived from identified edits. e Total number of edits identified in all samples. The normal sites are those sites identified from 1797 normal, healthy samples, while the abnormal sites are those identified from 274 pathological samples (e.g., samples undergoing uniparental disomy (UPD) from Dataset GSE13385438), or samples with non-control treatment (e.g., treated with amanitin as in Dataset GSE10157185). Also, see Supplementary Figs. 10–12 for the comparison of the genomic distribution of normal and abnormal edits of the same stage. f A-to-G ratios for all variants detected across all samples. The proportion is defined as the union of strand-definite A-to-G variants and strand-ambiguous A-to-G/T-to-C variants (see Step (13) of Supplementary Note 1) to all variants. See also Supplementary Fig. 9 for this metric in Alu- and non-Alu-subsets. g Alu ratios for all edits across all samples. h The signature ADAR-binding motif computed from all edits. i The profile of the BLCAP Y2C recoding edit across stages; the horizontal stripes represent edited samples with the color denoting the editing level. Arrows indicate the direction from the 5'- to the 3'-end (for DNA and RNA) or from the N-terminal to the C-terminal (for protein). Symbols in boxplots follow the definition by “geom_boxplot” of the R package “ggplot2”96: the inner thick line indicates the median; the lower and upper boundaries (or hinges) of the box indicate the first and third quartiles (i.e., 25 and 75% quantiles), respectively; the upper whisker extends from the hinge to the largest value no further than 1.5 × inter-quartile range (the third quartile minus the first quartile), the lower whisker extends from the hinge to the smallest value at most 1.5 × inter-quartile range of the hinge, and data beyond the end of the whiskers are the outlier points, which are plotted individually.

