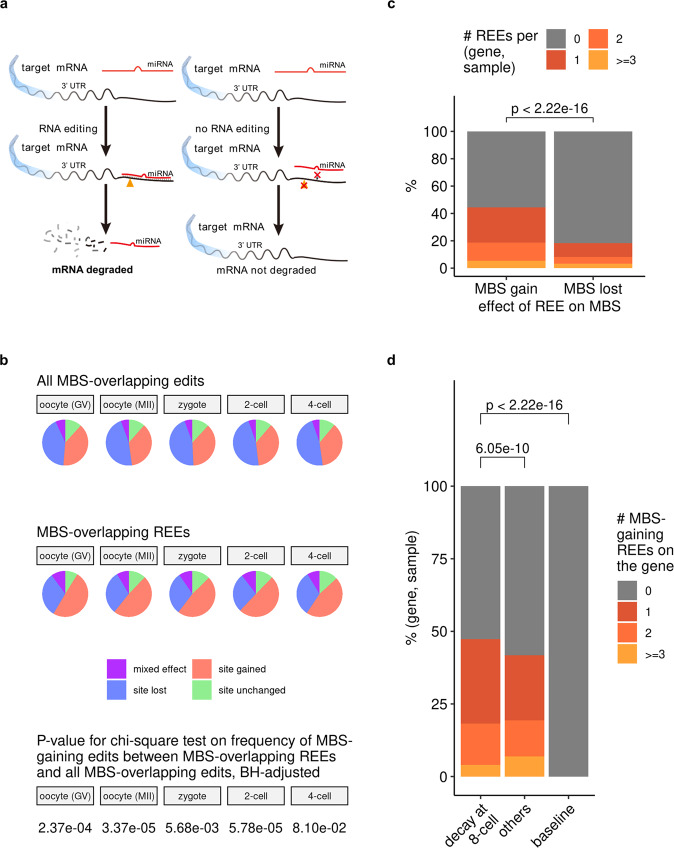
Fig. 5. REEs induced more microRNA binding sites (MBSs) on maternal clearance targets than on nontargets.
a An example model of how RNA editing can result in the gaining of new MBSs. b 3'-UTR REEs are more likely to gain MBSs than general 3'-UTR edits. The BH-adjusted p values for the chi-square test on the frequency of MBS-gaining edits between MBS-overlapping REEs and all MBS-overlapping edits (where the null hypothesis is that whether an edit is MBS-gaining is independent of whether this edit is REE) were also shown. See Supplementary Data 25 (the source data behind Fig. 5b) for the number of site-gained (or non-site-gained) edits (or REEs) in each stage, and see also Supplementary Fig. 29, where no-overlap edits were also considered. c REEs are more likely to result in new MBS gains than in preexisting MBS losses. The p value was derived from the one-tailed, paired Wilcoxon’s rank-sum test, with the alternative hypothesis being that the median value for the “MBS gain” group would be greater than that for the “MBS lost” group on each pair of (gene, sample). In total, this paired test involves 36,281 pairs of gene and sample (as described in Supplementary Data 26), and the estimated (pseudo)median and 95 percent confidence interval reported by R are 1.000017 and [1.000001, +∞), respectively. d Genes targeted by maternal mRNA clearance have more MBS-gaining REEs than do other maternal genes (also see Supplementary Fig. 30). All p values were unadjusted and were derived from one-tailed, unpaired Wilcoxon’s rank-sum tests, with the alternative hypothesis being that the median value for the left (“decay at 8-cell”; see the subsection: Annotation of maternal genes and targets of maternal mRNA clearance in Methods for more details about “decay at 8-cell” and “others'') group would be greater than that for the right (others/baseline) group. The baseline group is just a value of 0; we plotted it here for the sake of visual clarity. The unpaired test between “decay at 8-cell” and “others” involves 17,060 and 17,755 pairs of (gene, sample) for “decay at 8-cell” and “others”, respectively, and its estimated (pseudo)median and 95 percent confidence interval reported by R are 8.957086 × 10⁻⁵ and [8.636118 × 10⁻⁵, +∞), respectively. The test between “decay at 8-cell” and the 0 baseline involves 17,060 pairs of (gene, sample) for “decay at 8-cell”, and has an estimated (pseudo)median of 1.499948 and a 95 percent confidence interval of [1.499974, +∞) as reported by R.

