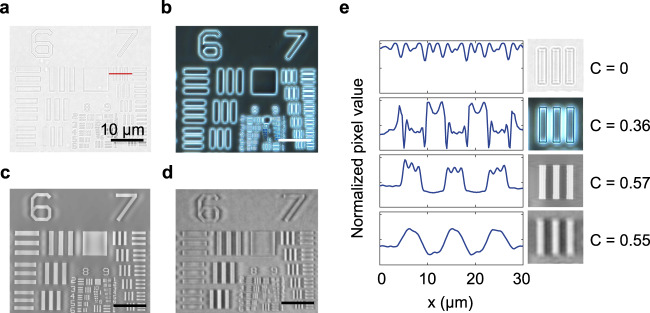
Fig. 4. A quantitative comparison of conventional and NLM phase contrast images.
a Bright field image of a phase-contrast calibration sample. b Phase contrast image of the calibration sample recorded with Zernike’s method. c, d. c Simulated, and d. experimental phase contrast images taken with the NLM. e Line profiles of the bars in group 7 of the calibration sample (indicated by the red line in panel a) allow for a quantitative comparison of the different imaging approaches. From top to bottom, the profiles are extracted from panels a, b, c, and d, respectively. C represents the contrast values. All images are measured on a polymer USAF target (n = 1.5) that has 200 nm thickness.

