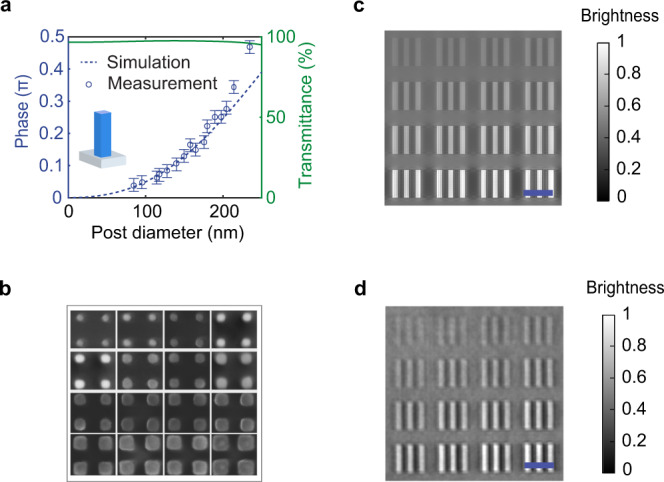
Fig. 5. Quantitative phase retrieval using an NLM.

a Transmission and phase delay from 2D periodic arrays of Si3N4 nanorods with heights of h = 230 nm and lattice constant a = 360 nm. The inset shows the structure of a single cell. The error bars show a reference of phase difference with respect to the measured phase. b SEM image of different area of the fabricated metasurface. c Simulated NLM phase contrast image. d Measured NLM phase contrast image. Scale bar corresponds to 20 µm.
