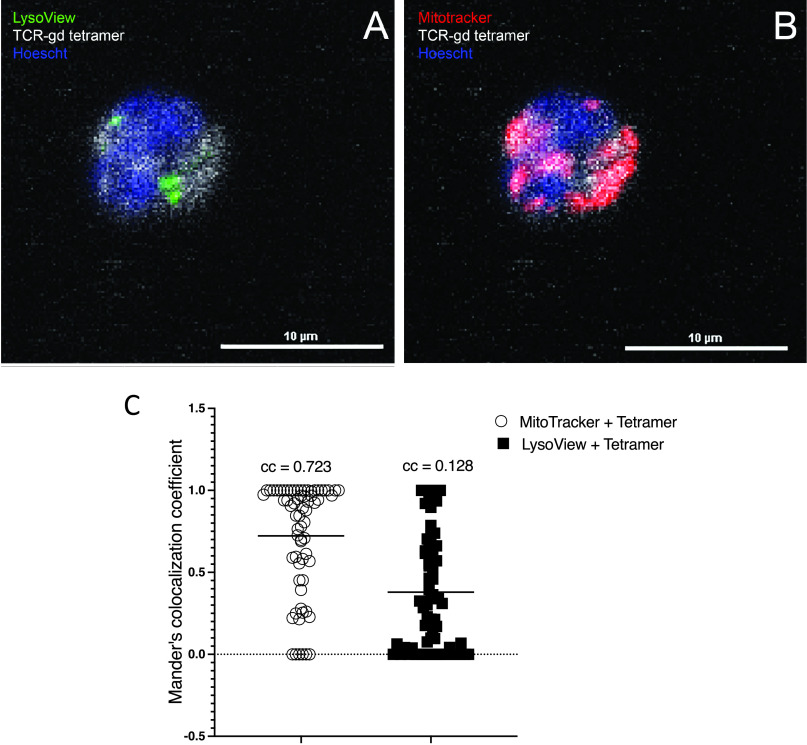
FIGURE 9.
Intracellular TCR-γδ ligand colocalizes with mitochondria. (A and B) Freshly isolated monocytes were stained with LysoView (green) (A), MitoTracker (red) (B), sTCR-γδ tetramer (white), and Hoechst stain for nuclei (blue) and analyzed by confocal microscopy. Shown are representative two-dimensional images illustrating colocalization of the TCR-γδ ligand with mitochondria. (C) Colocalization coefficients (ccs) are shown for each of the 67 cells analyzed. Number inserts indicate the mean ccs.

