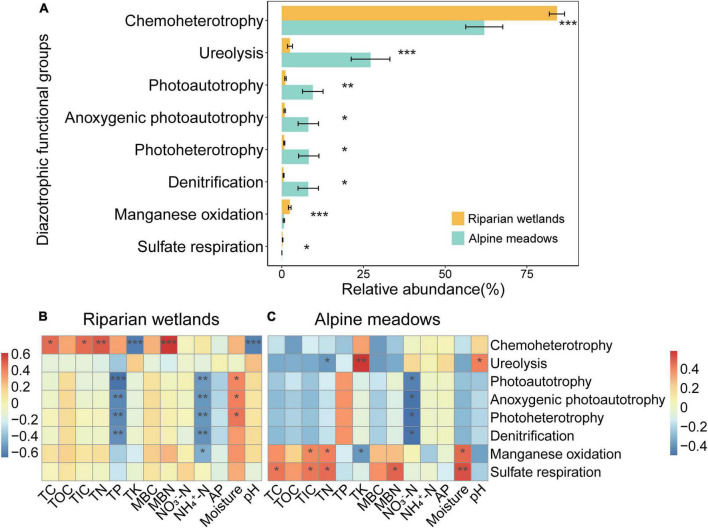
FIGURE 4.
The functional profiles of soil diazotrophic communities. (A) The relative abundance of diazotrophic functional groups in the riparian wetland and alpine meadow soils. Only the functional groups showed significant differences are shown. All the data were presented as mean ± SE. (B) The relationships between the relative abundance of soil diazotrophic functional groups and soil properties in the riparian wetlands. (C) The relationships between the relative abundance of soil diazotrophic functional groups and soil properties in the alpine meadows. TC, soil total carbon content; TOC, soil total organic carbon content; TIC, soil total inorganic carbon content; TN, soil total nitrogen content; TP, soil total phosphorus content; TK, soil total potassium content; MBC, soil microbial biomass carbon content; MBN, soil microbial biomass nitrogen content; NO3–-N, soil nitrate nitrogen content; NH4+-N, soil ammonium nitrogen content; AP, soil available phosphorus content, and moisture: soil moisture content. Asterisks indicate the significance of the ANOVA results (*P < 0.05; **P < 0.01; and ***P < 0.001).

